Matplotlib ရှိ tick အရေအတွက်ကို ဘယ်လိုပြောင်းမလဲ။
Matplotlib ရှိ ဝင်ရိုးတစ်ခုစီရှိ tick အရေအတွက်ကို ပြောင်းလဲရန် အောက်ပါ syntax ကို သင်အသုံးပြုနိုင်ပါသည်။
 #specify number of ticks on x-axis
plt. locator_params (axis=' x ', nbins= 4 )

#specify number of ticks on y-axis
plt. locator_params (axis=' y ', nbins= 2 )
nbins အငြင်းအခုံသည် ဝင်ရိုးတစ်ခုစီတွင်ပြသရန် tick အရေအတွက်ကို သတ်မှတ်သည်။
အောက်ပါဥပမာများသည် ဤ syntax ကိုလက်တွေ့တွင်မည်သို့အသုံးပြုရမည်ကိုပြသထားသည်။
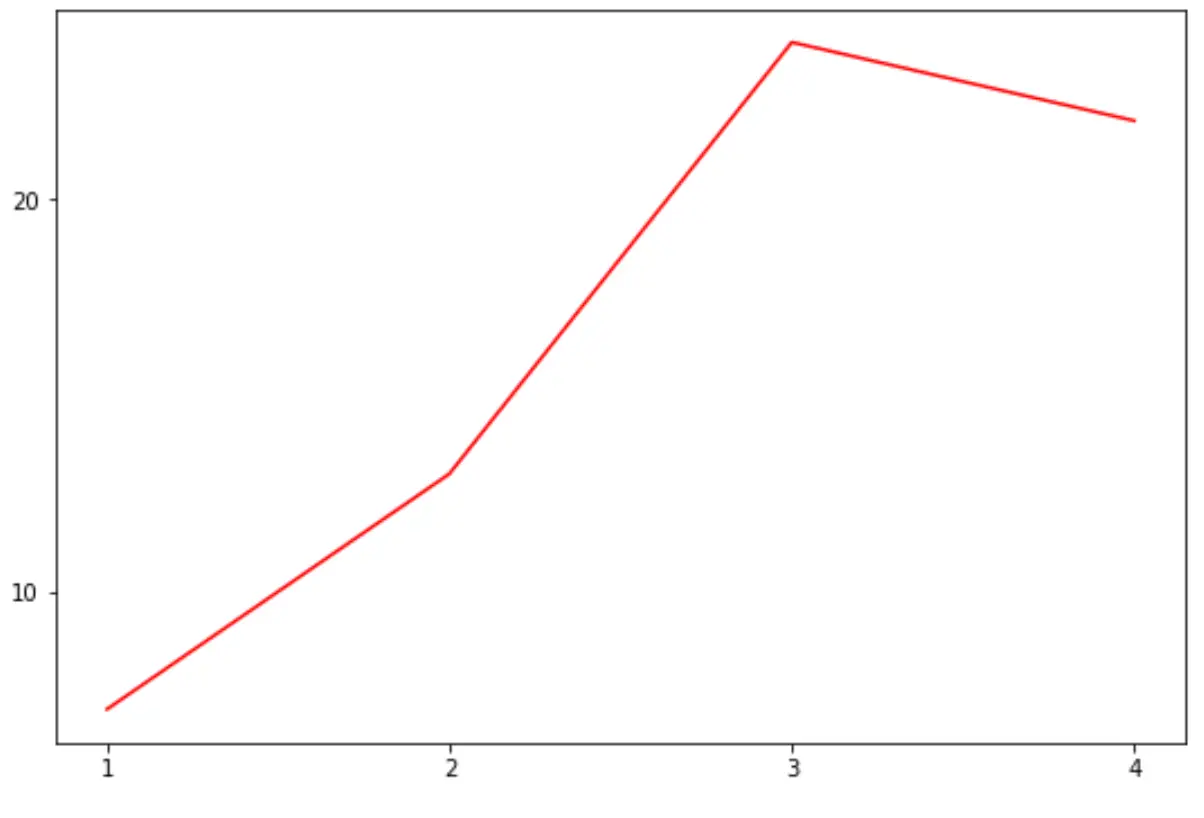
ဥပမာ 1- axes နှစ်ခုလုံးရှိ tick အရေအတွက်ကို သတ်မှတ်ပါ။
အောက်ဖော်ပြပါ ကုဒ်သည် ကွက်ကွက်တစ်ခုရှိ ပုဆိန်ပေါ်ရှိ အမှတ်အသားနှစ်ခုလုံးကို သတ်မှတ်နည်းကို ပြသသည်-
 import matplotlib. pyplot as plt

#define data
x = [1, 2, 3, 4]
y = [7, 13, 24, 22]

#createplot
plt. plot (x,y,color=' red ')

#specify number of ticks on axes
plt. locator_params (axis=' x ', nbins= 4 )
plt. locator_params (axis=' y ', nbins= 2 )
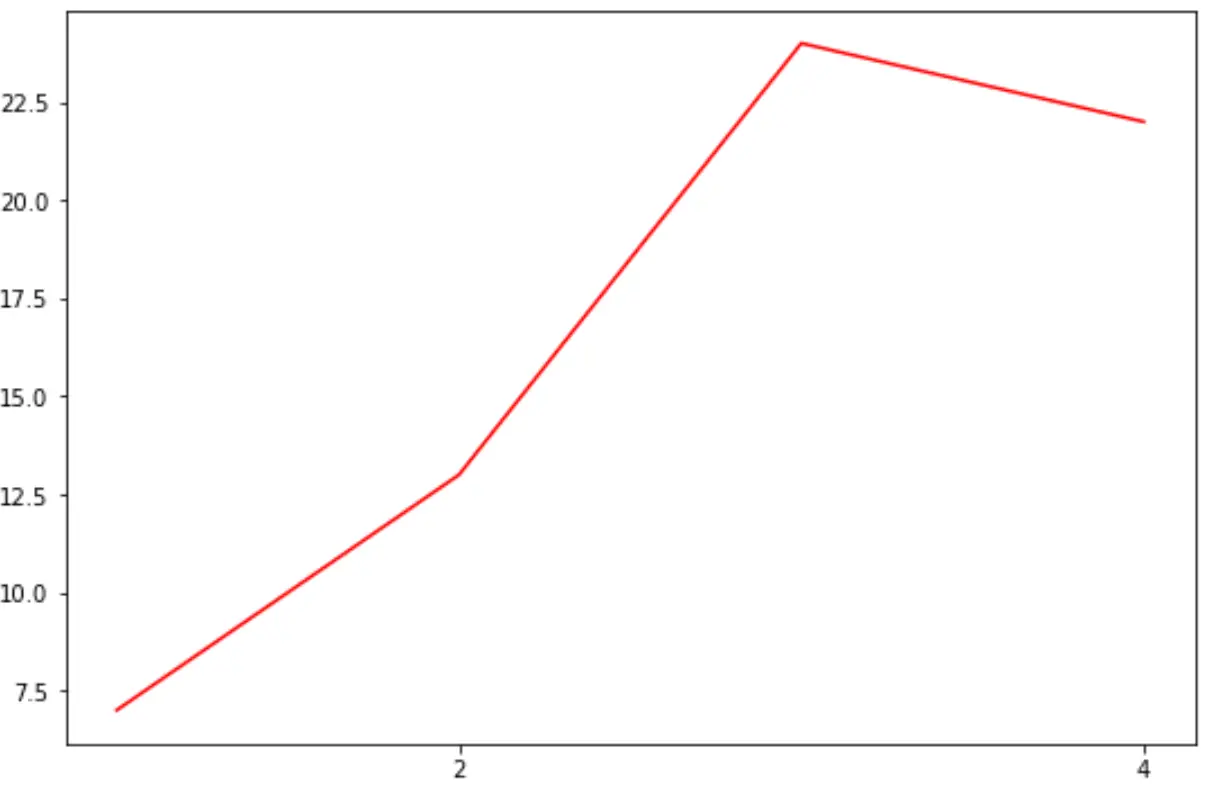
ဥပမာ 2- X ဝင်ရိုးပေါ်တွင်သာ အမှတ်အသားအရေအတွက်ကို သတ်မှတ်ပါ။
အောက်ပါကုဒ်သည် X ဝင်ရိုးပေါ်တွင်သာ tick အရေအတွက်ကို သတ်မှတ်နည်းကို ပြသသည်-
 import matplotlib. pyplot as plt

#define data
x = [1, 2, 3, 4]
y = [7, 13, 24, 22]

#createplot
plt. plot (x,y,color=' red ')

#specify number of ticks on x-axis
plt. locator_params (axis=' x ', nbins= 2 )
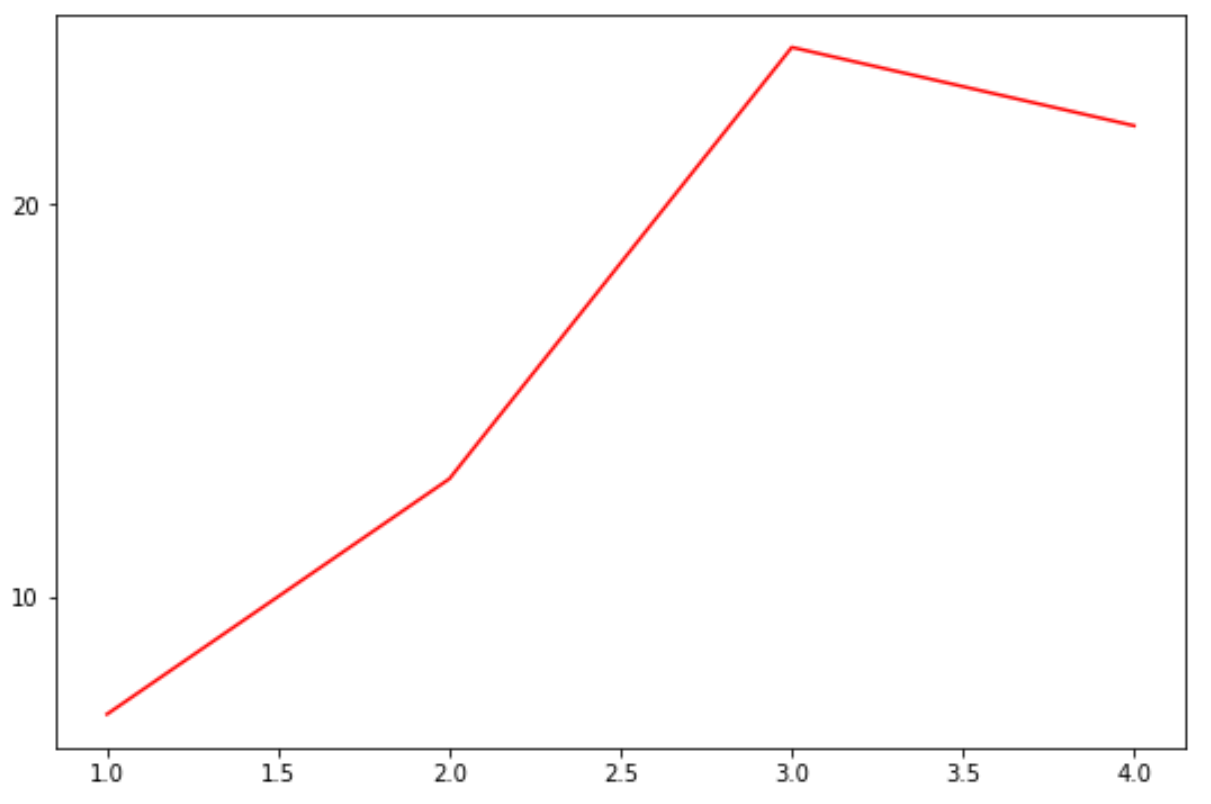
ဥပမာ 3- Y ဝင်ရိုးပေါ်တွင်သာ အမှတ်အသားအရေအတွက်ကို သတ်မှတ်ပါ။
အောက်ပါကုဒ်သည် Y ဝင်ရိုးပေါ်တွင်သာ tick အရေအတွက်ကို သတ်မှတ်နည်းကို ပြသသည်-
 import matplotlib. pyplot as plt

#define data
x = [1, 2, 3, 4]
y = [7, 13, 24, 22]

#createplot
plt. plot (x,y,color=' red ')

#specify number of ticks on y-axis
plt. locator_params (axis=' y ', nbins= 2 )
ထပ်လောင်းအရင်းအမြစ်များ
Matplotlib ကွက်များမှ tick များကိုမည်သို့ဖယ်ရှားနည်း
Matplotlib ရှိ checkmark အညွှန်းများ၏ ဖောင့်အရွယ်အစားကို သတ်မှတ်နည်း
Matplotlib တွင် X ဝင်ရိုးတန်ဖိုးများသတ်မှတ်နည်း
Matplotlib တွင် ဝင်ရိုးအပိုင်းအခြားများ သတ်မှတ်နည်း
စာရေးသူအကြောင်း
Benjamin Anderson
မင်္ဂလာပါ၊ ကျွန်ုပ်သည် အငြိမ်းစား စာရင်းအင်း ပါမောက္ခ ဘင်ဂျမင်ဖြစ်ပြီး သီးသန့် Statorials ဆရာအဖြစ် လှည့်ပတ်ပါသည်။ စာရင်းဇယားနယ်ပယ်တွင် ကျယ်ပြန့်သောအတွေ့အကြုံနှင့် ကျွမ်းကျင်မှုနှင့်အတူ၊ Statorials မှတစ်ဆင့် ကျောင်းသားများကို ခွန်အားဖြစ်စေရန်အတွက် ကျွန်ုပ်၏အသိပညာကို မျှဝေလိုပါသည်။ ပိုသိတယ်။