Matplotlib တွင် axes လှန်နည်း (ဥပမာများနှင့်အတူ)
Matplotlib တွင် x-axis နှင့် y-axis ကိုလှန်ရန် အောက်ပါအခြေခံ syntax ကိုသုံးနိုင်သည်။
 plt. gca (). invert_xaxis ()
plt. gca (). invert_yaxis ()
အောက်ဖော်ပြပါ ဥပမာသည် ဤ syntax ကို လက်တွေ့တွင် မည်သို့အသုံးပြုရမည်ကို ပြသထားသည်။
ဥပမာ- Matplotlib ရှိ ပြောင်းပြန်ပုဆိန်များ
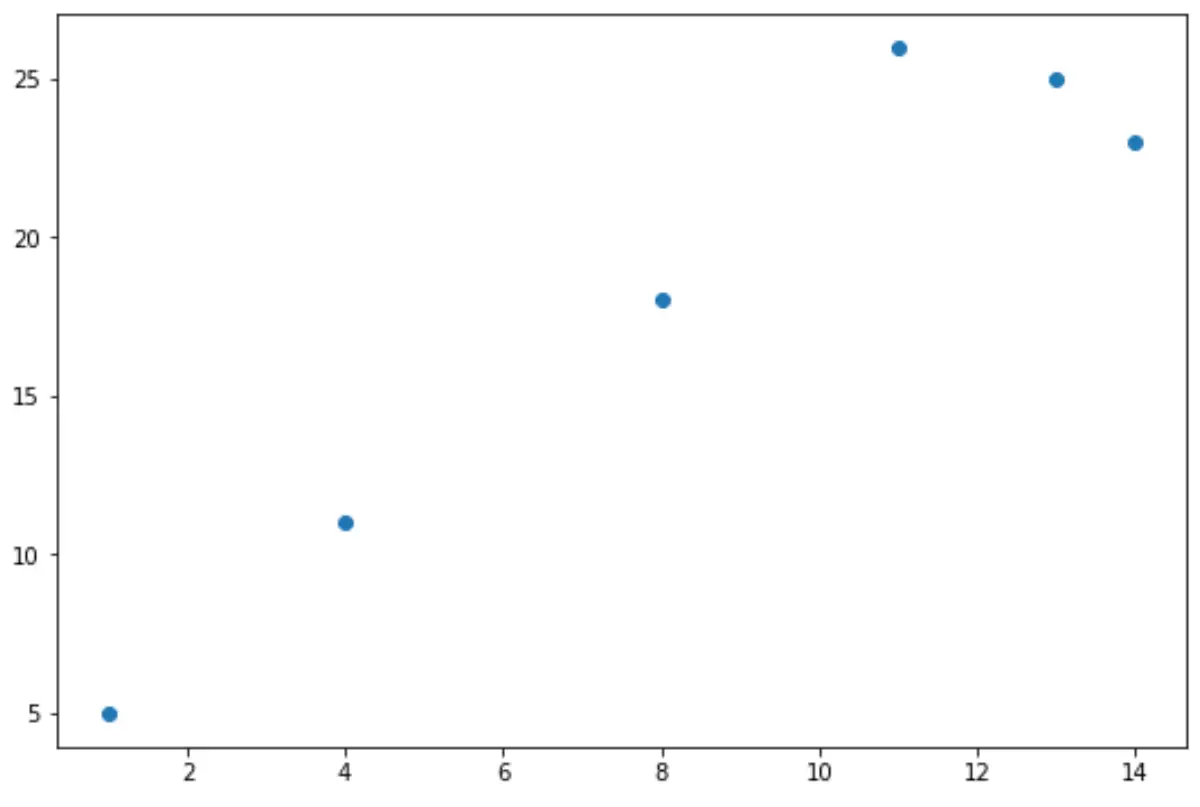
အောက်ပါကုဒ်သည် Matplotlib တွင် အခြေခံ scatterplot ဖန်တီးနည်းကို ပြသသည် ။
 import matplotlib. pyplot as plt

#define x and y
x = [1, 4, 8, 11, 13, 14]
y = [5, 11, 18, 26, 25, 23]

#create scatterplot of x and y
plt. scatter (x,y)
ကျွန်ုပ်တို့သည် y-ဝင်ရိုးကိုလှန် ရန် အောက်ပါကုဒ်ကိုသုံးနိုင်သည်။
 import matplotlib. pyplot as plt

#define x and y
x = [1, 4, 8, 11, 13, 14]
y = [5, 11, 18, 26, 25, 23]

#create scatterplot of x and y
plt. scatter (x,y)

#reverse y-axis
plt. gca (). invert_yaxis ()
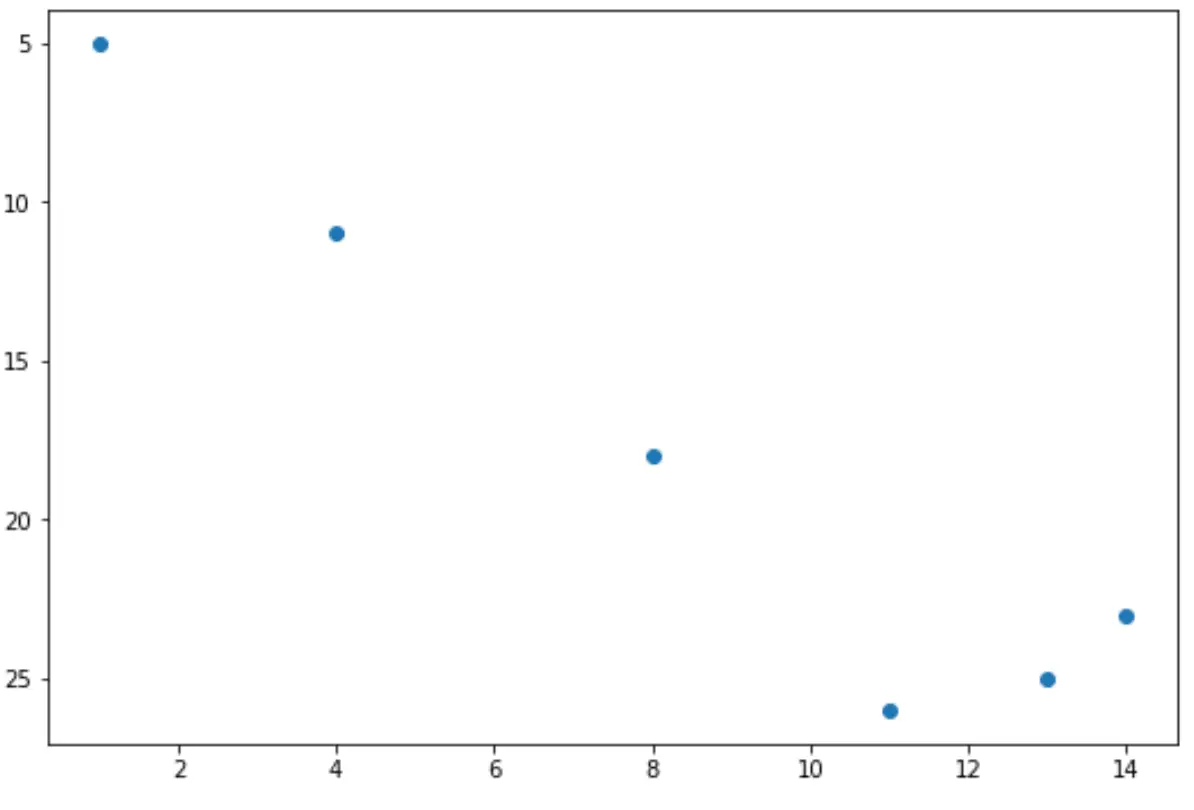
ယခု y ဝင်ရိုးသည် 5 မှ 25 အစား 25 မှ 5 သို့သွားကြောင်း သတိပြုပါ။
တနည်းအားဖြင့် x-axis ကိုလှန် ရန် အောက်ပါကုဒ်ကို အသုံးပြုနိုင်သည်။
 import matplotlib. pyplot as plt

#define x and y
x = [1, 4, 8, 11, 13, 14]
y = [5, 11, 18, 26, 25, 23]

#create scatterplot of x and y
plt. scatter (x,y)

#reverse x-axis
plt. gca (). invert_xaxis ()
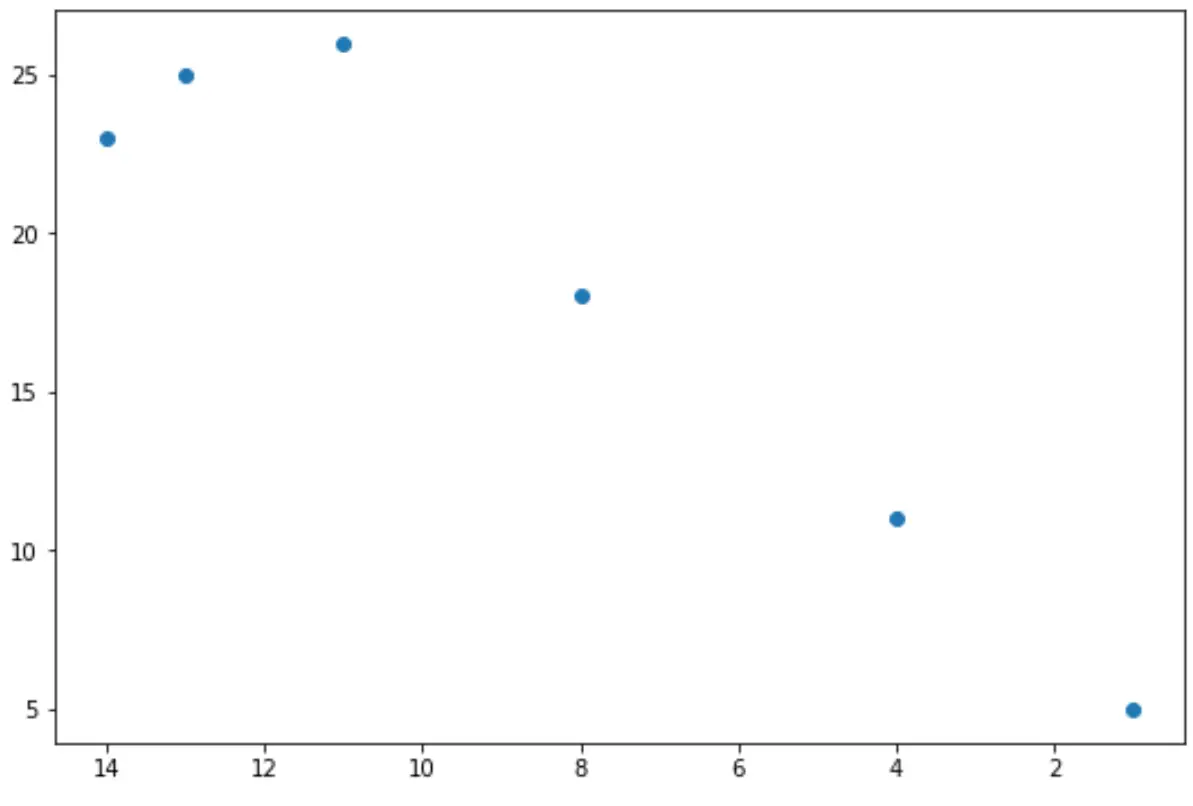
ယခု X ဝင်ရိုးသည် 0 မှ 14 အစား 14 မှ 0 သို့သွားကြောင်း သတိပြုပါ။
နောက်ဆုံးတွင်၊ axes နှစ်ခုကို ပြောင်းပြန်လှန်ရန် အောက်ပါကုဒ်ကို အသုံးပြုနိုင်သည်။
 import matplotlib. pyplot as plt

#define x and y
x = [1, 4, 8, 11, 13, 14]
y = [5, 11, 18, 26, 25, 23]

#create scatterplot of x and y
plt. scatter (x,y)

#reverse both axes
plt. gca (). invert_xaxis ()
plt. gca (). invert_yaxis ()
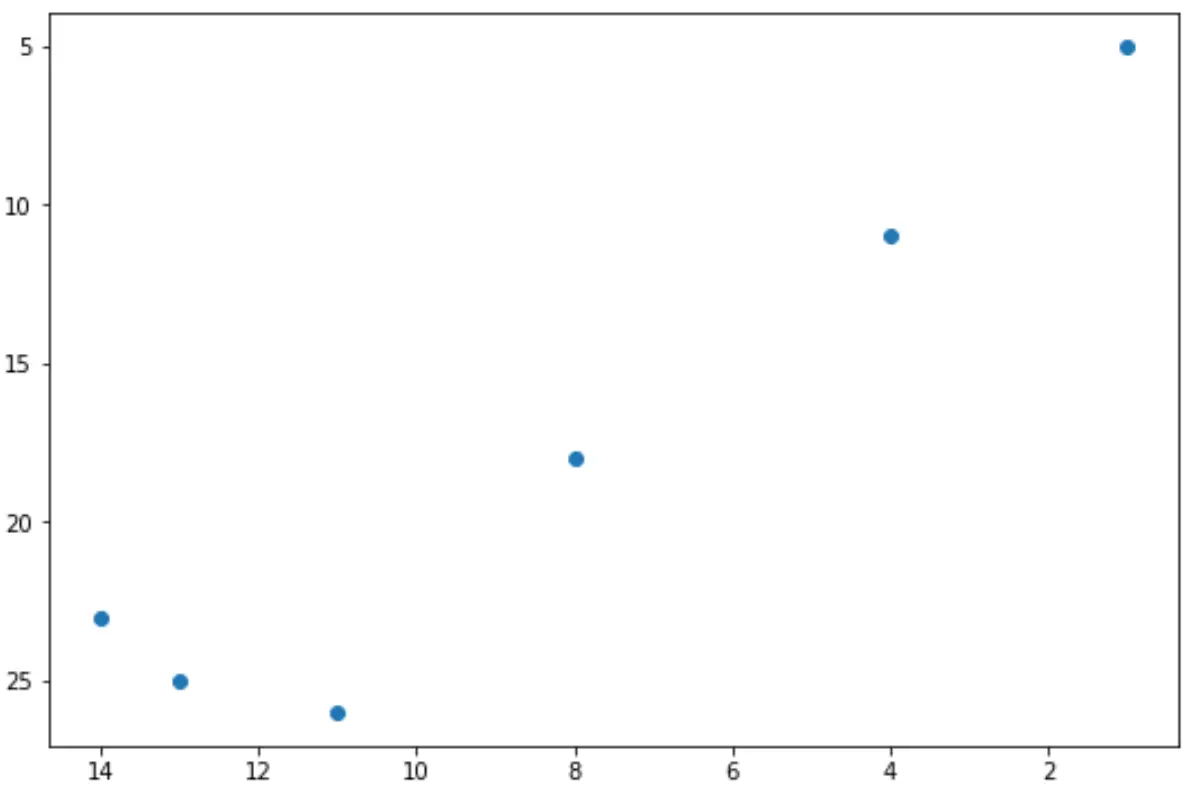
axes နှစ်ခု၏ တန်ဖိုးများသည် ပြောင်းပြန်ဖြစ်ကြောင်း သတိပြုပါ။
ထပ်လောင်းအရင်းအမြစ်များ
အောက်ဖော်ပြပါ သင်ခန်းစာများသည် Matplotlib ရှိ အခြားသော ဘုံလုပ်ဆောင်ချက်များကို မည်သို့လုပ်ဆောင်ရမည်ကို ရှင်းပြသည်-
Matplotlib တွင် ဝင်ရိုးအပိုင်းအခြားများ သတ်မှတ်နည်း
Matplotlib တွင် ဝင်ရိုးအမှန်ခြစ်များ သတ်မှတ်နည်း
Matplotlib ရှိ ဝင်ရိုးအညွှန်းတည်နေရာကို ချိန်ညှိနည်း
စာရေးသူအကြောင်း
Benjamin Anderson
မင်္ဂလာပါ၊ ကျွန်ုပ်သည် အငြိမ်းစား စာရင်းအင်း ပါမောက္ခ ဘင်ဂျမင်ဖြစ်ပြီး သီးသန့် Statorials ဆရာအဖြစ် လှည့်ပတ်ပါသည်။ စာရင်းဇယားနယ်ပယ်တွင် ကျယ်ပြန့်သောအတွေ့အကြုံနှင့် ကျွမ်းကျင်မှုနှင့်အတူ၊ Statorials မှတစ်ဆင့် ကျောင်းသားများကို ခွန်အားဖြစ်စေရန်အတွက် ကျွန်ုပ်၏အသိပညာကို မျှဝေလိုပါသည်။ ပိုသိတယ်။