Matplotlib တွင် manual legend တစ်ခုဖန်တီးနည်း (ဥပမာနှင့်အတူ)
matplotlib ကွက်ကွက်တစ်ခုတွင် ကိုယ်တိုင်ဒဏ္ဍာရီတစ်ခုဖန်တီးရန် matplotlib.lines နှင့် matplotlib.patches submodules များ၏ လုပ်ဆောင်ချက်များကို သင်အသုံးပြုနိုင်ပါသည်။
အောက်ပါဥပမာသည် ၎င်းကို မည်သို့လုပ်ဆောင်ရမည်ကို ပြသထားသည်။
ဥပမာ- Matplotlib တွင် ကိုယ်တိုင်ဒဏ္ဍာရီတစ်ခုကို ဖန်တီးပါ။
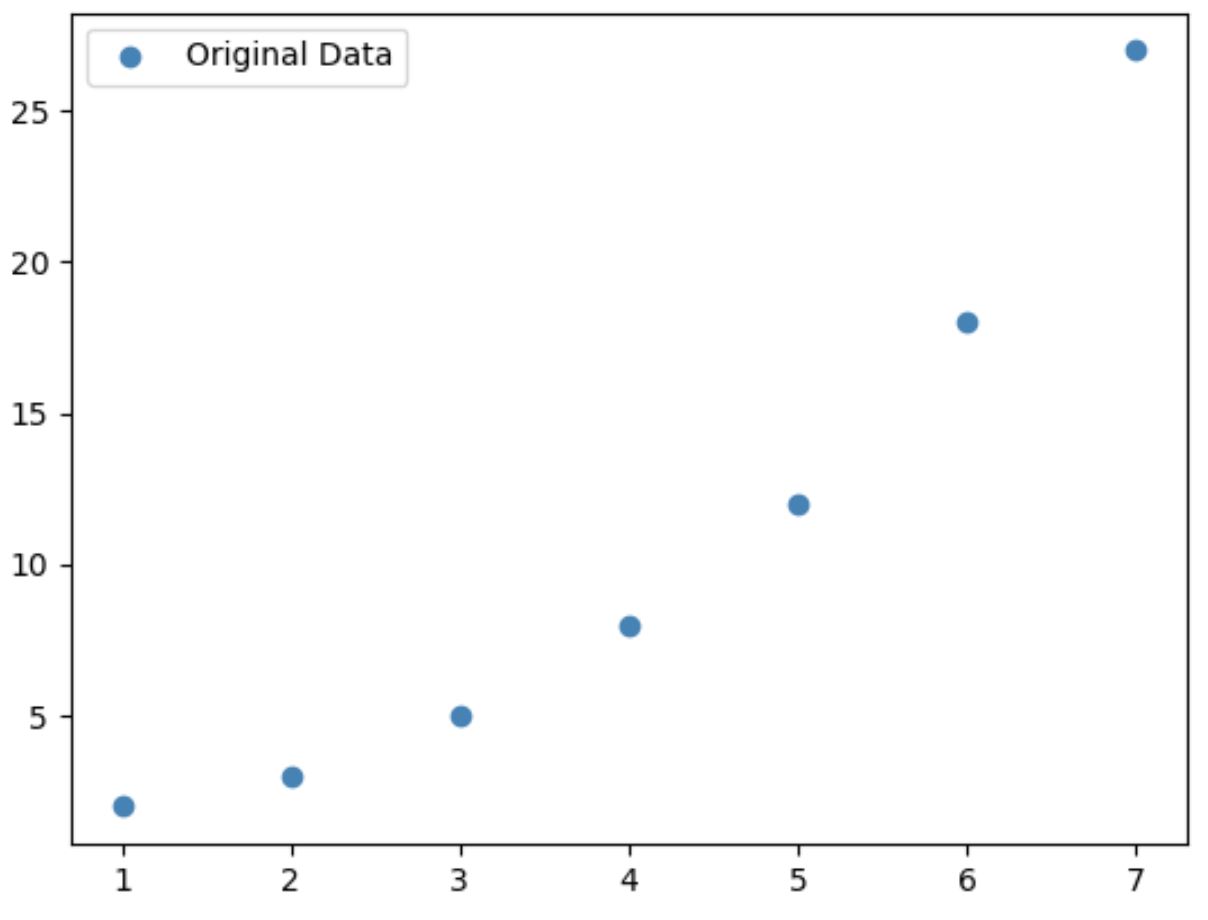
အောက်ပါကုဒ်သည် ပုံသေဒဏ္ဍာရီဖြင့် matplotlib တွင် scatterplot တစ်ခုကို ဖန်တီးနည်းကို ပြသသည်-
 import matplotlib. pyplot as plt

#define data to plot
x = [1, 2, 3, 4, 5, 6, 7]
y = [2, 3, 5, 8, 12, 18, 27]

#create scatter plot of x vs. y
plt. scatter (x, y, label=' Original Data ', color=' steelblue ')

#add legend
plt. legend ()

#displayplot
plt. show ()
စိတ်ကြိုက်လိုင်းများနှင့် စတုရန်းများဖြင့် လက်စွဲစာအုပ်ကို ဖန်တီးရန်၊ ကျွန်ုပ်တို့သည် matplotlib.lines နှင့် matplotlib.patches submodules များကို တင်သွင်းရန် လိုအပ်ပါသည်။
လက်စွဲအသုံးအနှုန်းတစ်ခုဖန်တီးရန် အောက်ပါကုဒ်သည် ဤပုံစံငယ်များကို အသုံးပြုနည်းကို ပြသသည်-
 import matplotlib. pyplot as plt
from matplotlib. lines import Line2D
import matplotlib. patches as mpatches

#define data to plot
x = [1, 2, 3, 4, 5, 6, 7]
y = [2, 3, 5, 8, 12, 18, 27]

#create scatter plot of x vs. y
plt. scatter (x, y, label=' Original Data ', color=' steelblue ')

#define handles and labels that will get added to legend
handles, labels = plt. gca (). get_legend_handles_labels ()

#define patches and lines to add to legend
patch1 = mpatches. Patch (color=' orange ', label=' First Manual Patch ')
patch2 = mpatches. Patch (color=' orange ', label=' First Manual Patch ')
line1 = Line2D([0], [0], label=' First Manual Line ', color=' purple ')
line2 = Line2D([0], [0], label=' Second Manual Line ', color=' red ')

#add handles
handles. extend ([patch1, line1, line2])

#add legend
plt. legend (handles=handles)

#displayplot
plt. show ()
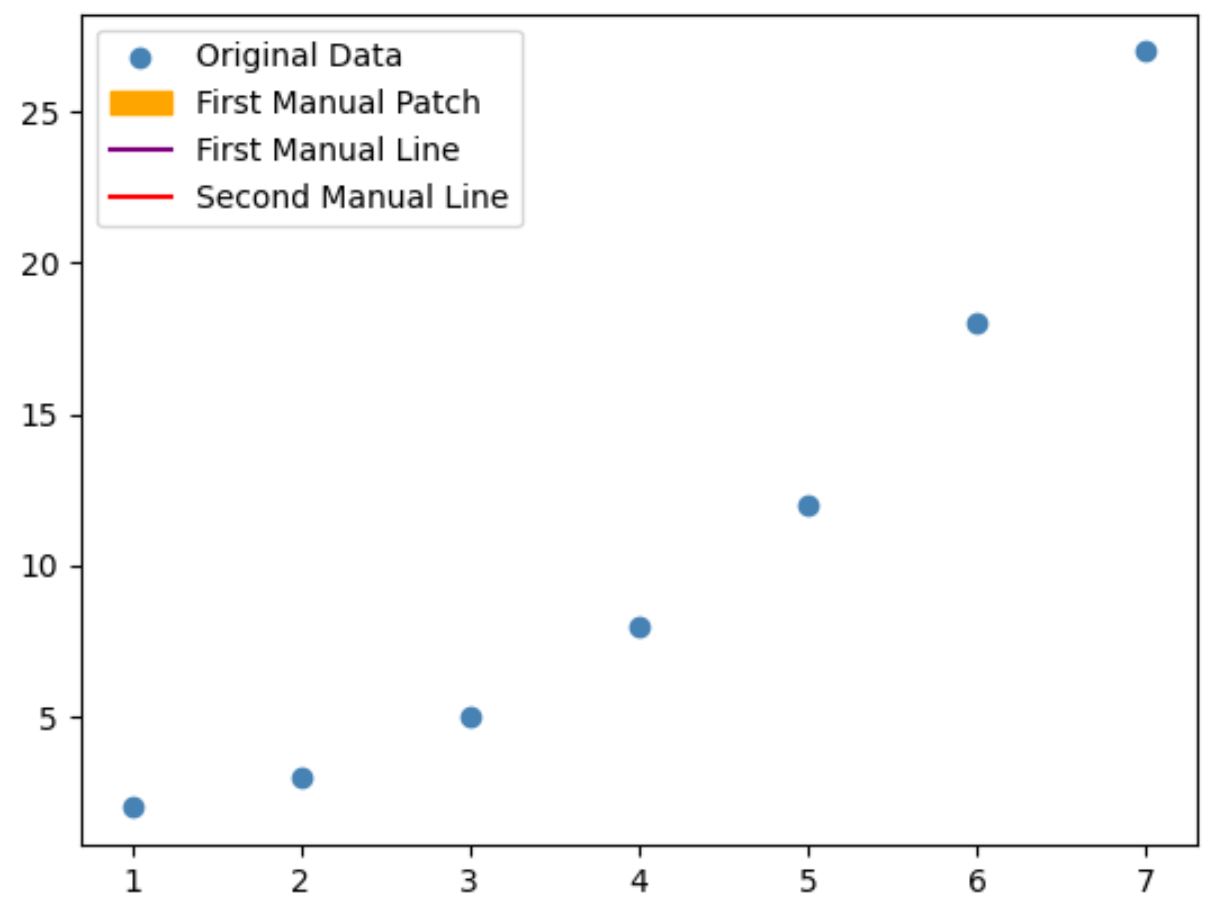
ဤဒဏ္ဍာရီတွင် မူရင်းဒေတာ၏ အညွှန်းပါ၀င်သည်၊ ကျွန်ုပ်တို့ကိုယ်တိုင်ထည့်သွင်းထားသော ဒြပ်စင်များ၏ အညွှန်းများနှင့် ပုံသဏ္ဍာန်များလည်း ပါဝင်ကြောင်း သတိပြုပါ။
ဒြပ်စင်တစ်ခုခု၏ အညွှန်းများ သို့မဟုတ် အရောင်များကို ပြောင်းလဲရန် ယခင်ကုဒ်အပိုင်းအစရှိ အညွှန်း ၏တန်ဖိုးများနှင့် အရောင် အငြင်းအခုံများကို ပြောင်းလဲပါ။
မှတ်ချက် – ဇာတ်ကွက်ရှိ ဒဏ္ဍာရီ၏ အနေအထားကို မည်သို့ပြောင်းလဲရမည်ကို လေ့လာရန် ဤသင်ခန်းစာကို ကိုးကားပါ။
ထပ်လောင်းအရင်းအမြစ်များ
အောက်ပါသင်ခန်းစာများသည် Matplotlib ရှိ အခြားဘုံအလုပ်များကို မည်သို့လုပ်ဆောင်ရမည်ကို ရှင်းပြသည်-
Matplotlib တွင် ကွက်ကွက်အရွယ်အစားကို မည်သို့တိုးမည်နည်း။
Matplotlib တွင် ခေါင်းစဉ်အနေအထားကို ချိန်ညှိနည်း
Matplotlib တွင် ဝင်ရိုးအပိုင်းအခြားများ သတ်မှတ်နည်း
စာရေးသူအကြောင်း
Benjamin Anderson
မင်္ဂလာပါ၊ ကျွန်ုပ်သည် အငြိမ်းစား စာရင်းအင်း ပါမောက္ခ ဘင်ဂျမင်ဖြစ်ပြီး သီးသန့် Statorials ဆရာအဖြစ် လှည့်ပတ်ပါသည်။ စာရင်းဇယားနယ်ပယ်တွင် ကျယ်ပြန့်သောအတွေ့အကြုံနှင့် ကျွမ်းကျင်မှုနှင့်အတူ၊ Statorials မှတစ်ဆင့် ကျောင်းသားများကို ခွန်အားဖြစ်စေရန်အတွက် ကျွန်ုပ်၏အသိပညာကို မျှဝေလိုပါသည်။ ပိုသိတယ်။