Matplotlib ရှိ subplot အရွယ်အစားကို ချိန်ညှိနည်း
Matplotlib ရှိ အပိုင်းခွဲများ၏ အရွယ်အစားကို ချိန်ညှိရန် အောက်ပါ syntax ကို သင် အသုံးပြုနိုင်ပါသည်။
 #specify one size for all subplots
fig, ax = plt. subplots (2, 2, figsize=(10,7))

#specify individual sizes for subplots
fig, ax = plt. subplots (1, 2, gridspec_kw={' width_ratios ': [3, 1]})
အောက်ပါဥပမာများသည် ဤ syntax ကိုလက်တွေ့တွင်မည်သို့အသုံးပြုရမည်ကိုပြသထားသည်။
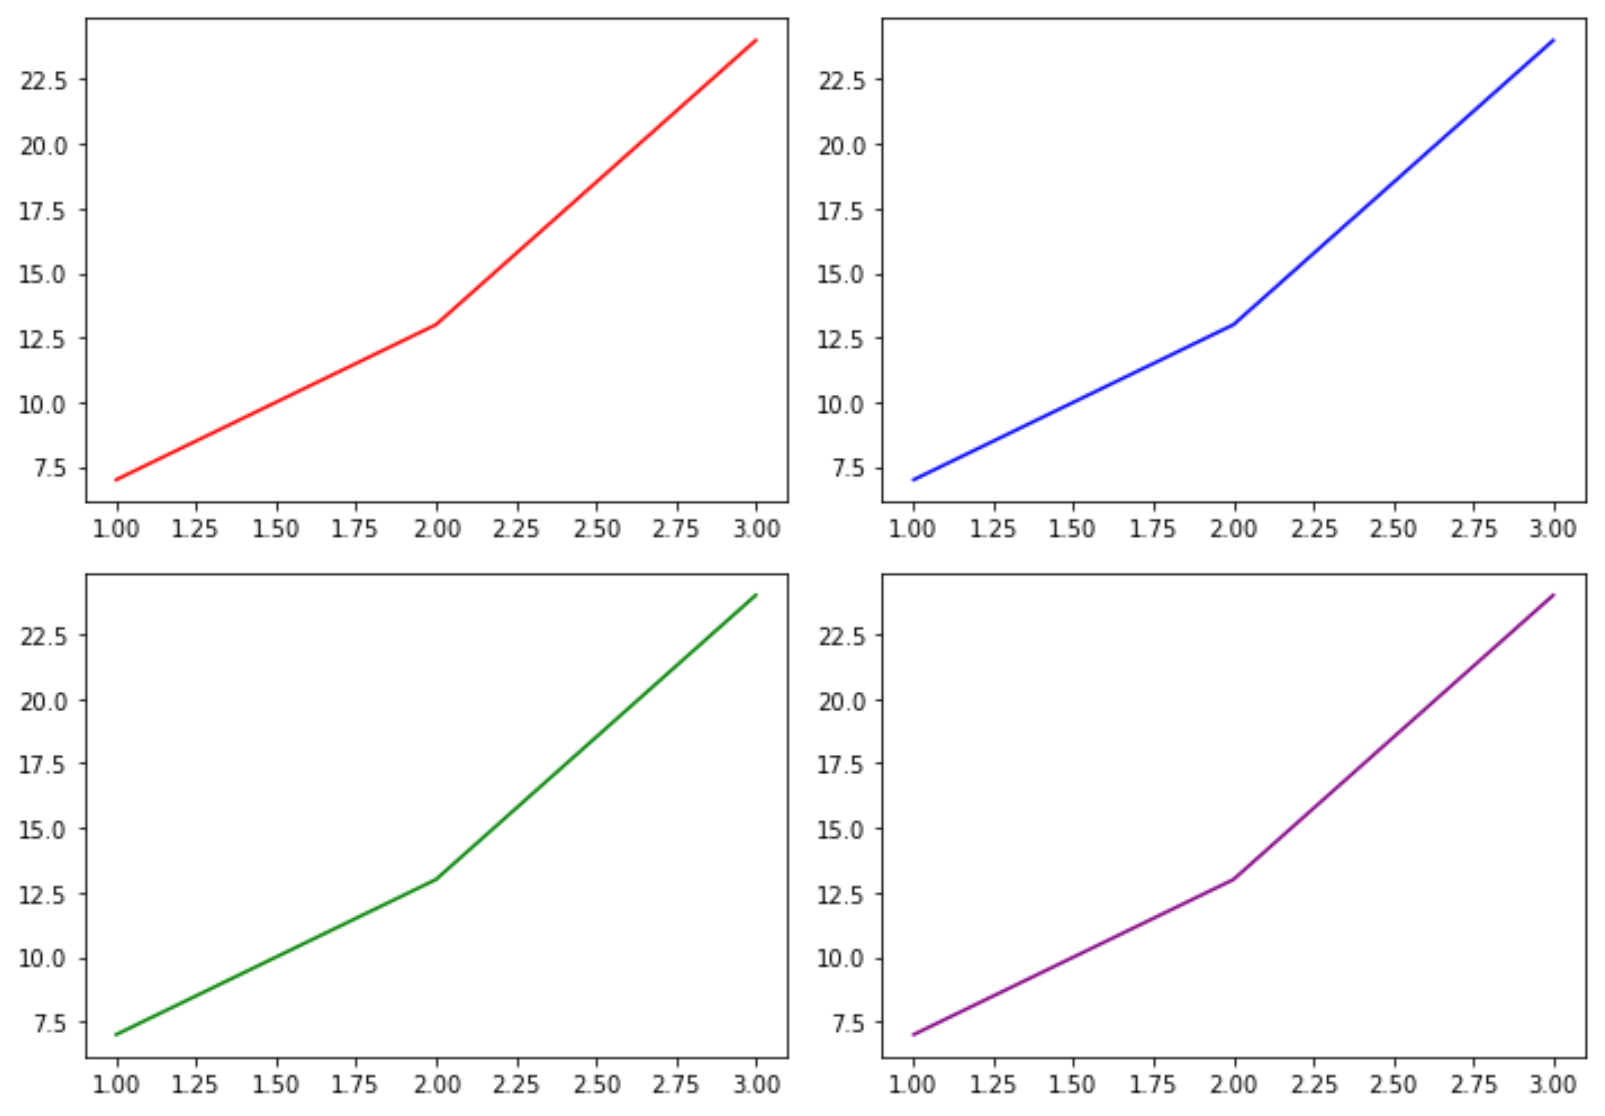
ဥပမာ 1- အပိုင်းခွဲအားလုံးအတွက် အရွယ်အစားကို သတ်မှတ်ပါ။
အောက်ဖော်ပြပါ ကုဒ်သည် အပိုင်းခွဲအားလုံးအတွက် အရွယ်အစားကို သတ်မှတ်နည်းကို ပြသည်-
 import matplotlib. pyplot as plt

#define subplots
fig, ax = plt. subplots (2, 2, figsize=(10,7))
fig. tight_layout ()

#define data
x = [1, 2, 3]
y = [7, 13, 24]

#create subplots
ax[0, 0]. plot (x,y,color=' red ')
ax[0, 1]. plot (x,y,color=' blue ')
ax[1, 0]. plot (x,y,color=' green ')
ax[1, 1]. plot (x,y,color=' purple ')
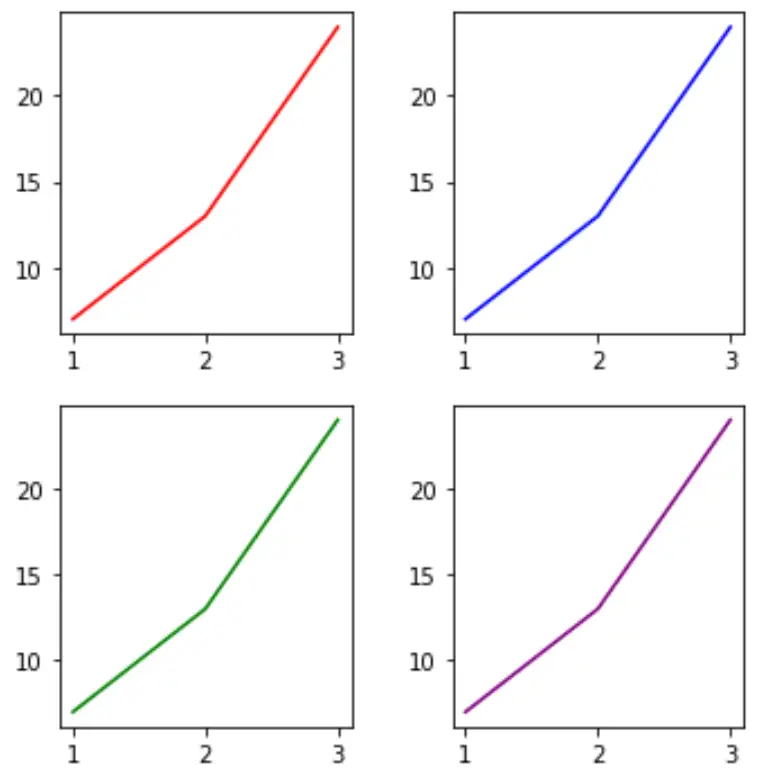
figsize argument ၏တန်ဖိုးများကိုပြောင်းလဲခြင်းဖြင့် အပိုင်းခွဲများ၏အရွယ်အစားကို အလွယ်တကူပြောင်းလဲနိုင်သည်-
 import matplotlib. pyplot as plt

#define subplots
fig, ax = plt. subplots (2, 2, figsize=(5,5))
fig. tight_layout ()

#define data
x = [1, 2, 3]
y = [7, 13, 24]

#create subplots
ax[0, 0]. plot (x,y,color=' red ')
ax[0, 1]. plot (x,y,color=' blue ')
ax[1, 0]. plot (x,y,color=' green ')
ax[1, 1]. plot (x,y,color=' purple ')
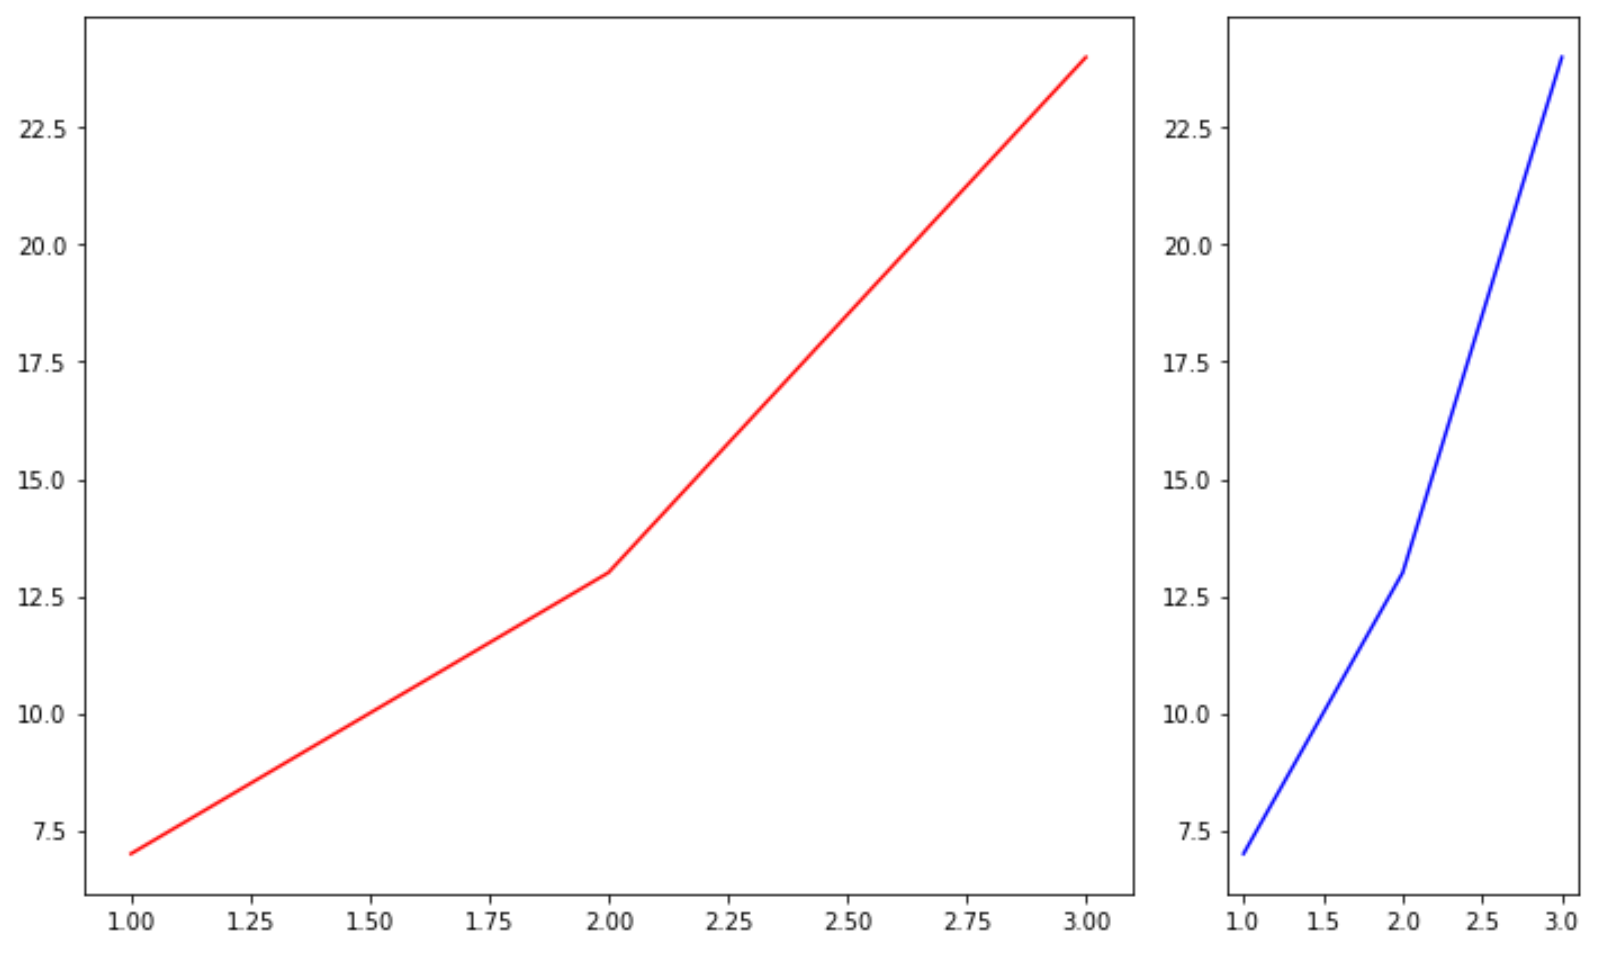
ဥပမာ 2- အပိုင်းခွဲ တစ်ခုချင်းစီ ၏ အရွယ်အစားများကို သတ်မှတ်ပါ။
အောက်ဖော်ပြပါ ကုဒ်သည် အပိုင်းခွဲတစ်ခုချင်းစီအတွက် မတူညီသောအရွယ်အစားများကို သတ်မှတ်နည်းကို ပြသသည်-
 import matplotlib. pyplot as plt

#define subplots
fig, ax = plt. subplots (1, 2, gridspec_kw={' width_ratios ': [3, 1]})
fig. tight_layout ()

#define data
x = [1, 2, 3]
y = [7, 13, 24]

#create subplots
ax[0]. plot (x,y,color=' red ')
ax[1]. plot (x,y,color=' blue ')
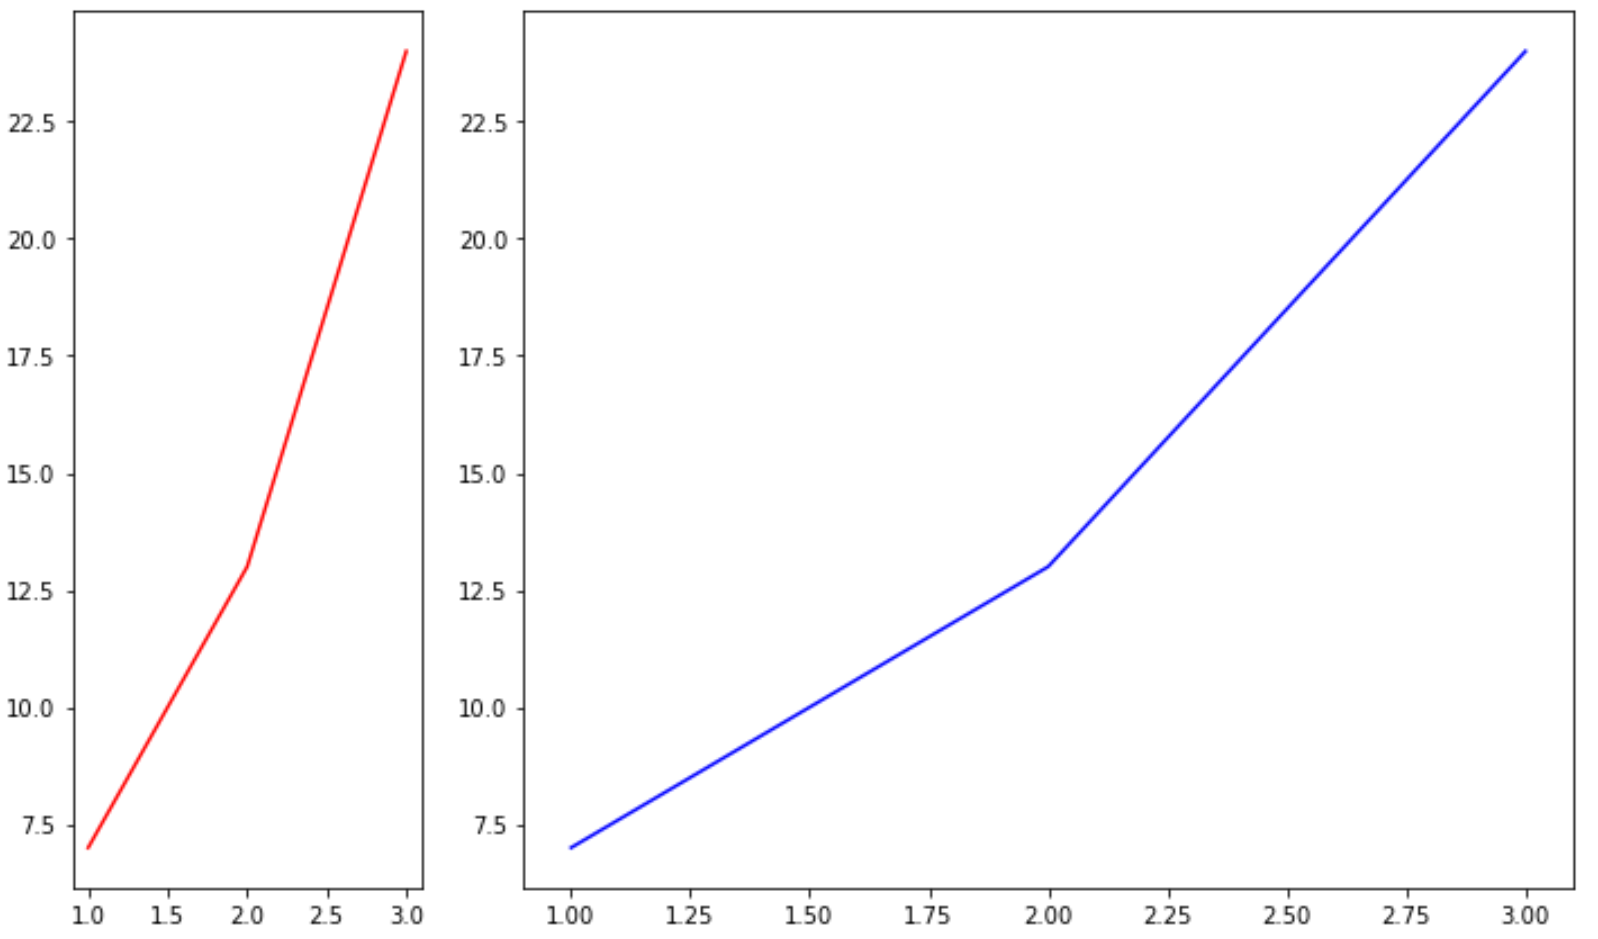
width_ratios အငြင်းအခုံရှိ တန်ဖိုးများကို ပြောင်းလဲခြင်းဖြင့် အပိုင်းခွဲများ၏ အရွယ်အစားကို အလွယ်တကူ ပြောင်းလဲနိုင်သည်-
 import matplotlib. pyplot as plt

#define subplots
fig, ax = plt. subplots (1, 2, gridspec_kw={' width_ratios ': [1, 3]})
fig. tight_layout ()

#define data
x = [1, 2, 3]
y = [7, 13, 24]

#create subplots
ax[0]. plot (x,y,color=' red ')
ax[1]. plot (x,y,color=' blue ')
ထပ်လောင်းအရင်းအမြစ်များ
Matplotlib ရှိ ကွက်များသို့ ခေါင်းစဉ်များထည့်နည်း
Matplotlib တွင် ဝင်ရိုးအပိုင်းအခြားများ သတ်မှတ်နည်း
Matplotlib တွင် X ဝင်ရိုးတန်ဖိုးများသတ်မှတ်နည်း
စာရေးသူအကြောင်း
Benjamin Anderson
မင်္ဂလာပါ၊ ကျွန်ုပ်သည် အငြိမ်းစား စာရင်းအင်း ပါမောက္ခ ဘင်ဂျမင်ဖြစ်ပြီး သီးသန့် Statorials ဆရာအဖြစ် လှည့်ပတ်ပါသည်။ စာရင်းဇယားနယ်ပယ်တွင် ကျယ်ပြန့်သောအတွေ့အကြုံနှင့် ကျွမ်းကျင်မှုနှင့်အတူ၊ Statorials မှတစ်ဆင့် ကျောင်းသားများကို ခွန်အားဖြစ်စေရန်အတွက် ကျွန်ုပ်၏အသိပညာကို မျှဝေလိုပါသည်။ ပိုသိတယ်။