Pandas ၏ histogram ၏ ပုံအရွယ်အစားကို မည်သို့ပြောင်းလဲမည်နည်း။
ပန်ဒါများတွင် ဖန်တီးထားသော ဟစ်စတိုဂရမ်၏ အရွယ်အစားကို ပြောင်းလဲရန် ပုံ ကြီး အရွယ်အစား အငြင်းအခုံကို အသုံးပြုနိုင်သည်။
 import matplotlib. pyplot as plt

#specify figure size (width, height)
fig = plt. figure (figsize=(8,3))
ax = fig. gca ()

#create histogram using specified figure size
df[' my_column ']. hist (ax=ax)
အောက်ဖော်ပြပါ ဥပမာသည် ရုပ်ပုံအရွယ်အစား အငြင်းအခုံကို လက်တွေ့တွင် မည်သို့အသုံးပြုရမည်ကို ပြသထားသည်။
ဥပမာ- ပန်ဒါဟီစတိုဂရမ်ပုံ၏ အရွယ်အစားကို မည်သို့ပြောင်းလဲမည်နည်း။
ကျွန်ုပ်တို့တွင် အောက်ပါ ပန်ဒါ DataFrame ရှိသည် ဆိုပါစို့။
 import pandas as pd

#createDataFrame
df = pd. DataFrame ({' player ': ['A', 'B', 'C', 'D', 'E', 'F', 'G', 'H',
                              'I', 'J', 'K', 'L', 'M', 'N', 'O', 'P'],
                   ' points ': [10, 12, 14, 15, 15, 15, 16, 17,
                              19, 19, 24, 24, 28, 30, 34, 34]})

#view first five rows of DataFrame
print ( df.head ())

  player points
0 to 10
1 B 12
2 C 14
3 D 15
4 E 15
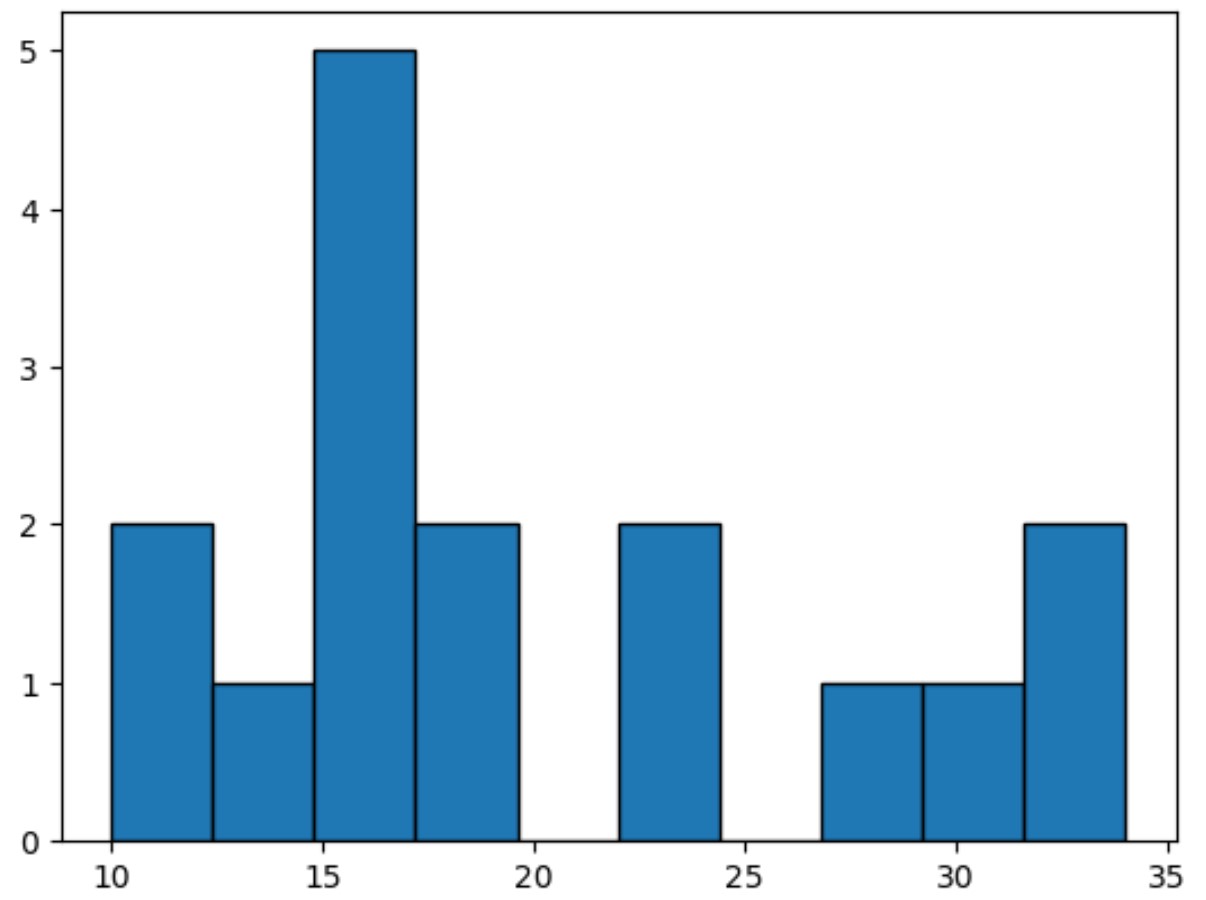
အချက်များ variable အတွက် histogram တစ်ခုကို ဖန်တီးပါက pandas သည် ပုံ၏ width အဖြစ် 6.4 နှင့် 4.8 ကို အမြင့် အဖြစ် အလိုအလျောက် အသုံးပြုလိမ့်မည် ။
 import matplotlib. pyplot as plt

#create histogram for variable points
df[' points ']. hist (grid= False ,edgecolor=' black ')
သို့သော်၊ ပုံ၏အကျယ်နှင့်အမြင့်ကိုပြောင်းလဲရန် figsize argument ကိုသုံးနိုင်သည်။
 import matplotlib. pyplot as plt

#specify figure size (width, height)
fig = plt. figure (figsize=(8,3))
ax = fig. gca ()

#create histogram using specified figure size
df[' points ']. hist ( grid= False , edgecolor=' black ', ax=ax)
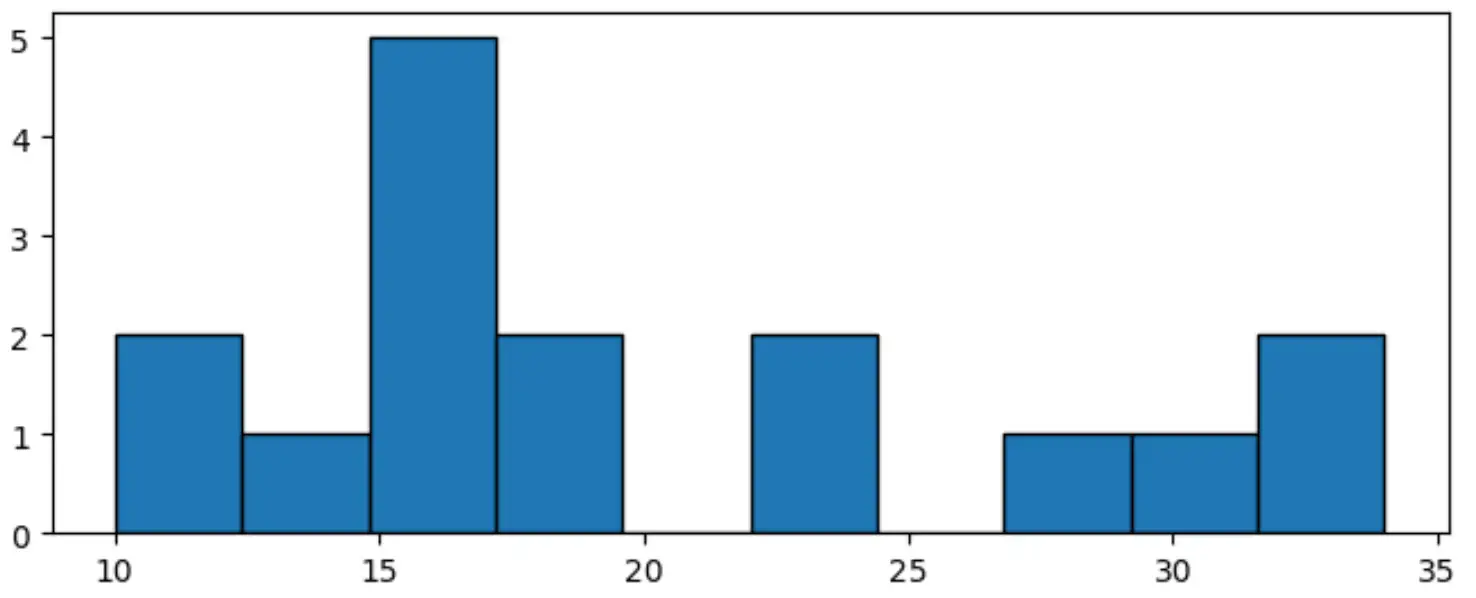
ဤအထူးသဖြင့် ဟစ်စတိုဂရမ်သည် အကျယ် 8 နှင့် အ မြင့် 3 ရှိသည်။
အကျယ်ထက် အရပ်ပိုကြီးသော ကိန်းဂဏန်းတစ်ခုကို ဖန်တီးရန် ပုံကြီးအရွယ်အစား အကြောင်းပြချက်ကိုလည်း အသုံးပြုနိုင်သည်။
 import matplotlib. pyplot as plt

#specify figure size (width, height)
fig = plt. figure (figsize=(4,7))
ax = fig. gca ()

#create histogram using specified figure size
df[' points ']. hist ( grid= False , edgecolor=' black ', ax=ax)
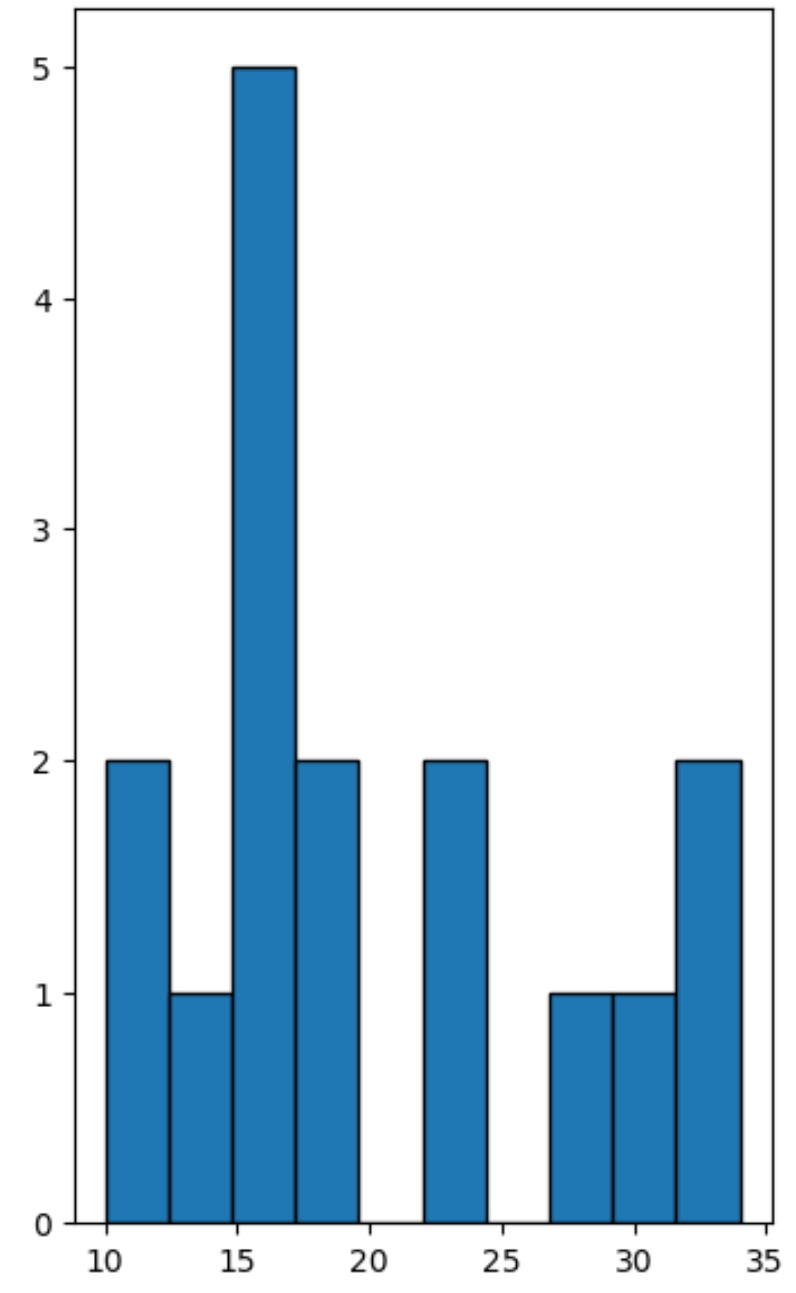
ဤအထူးသဖြင့် ဟစ်စတိုဂရမ်သည် အကျယ် 4 နှင့် အ မြင့် 7 ရှိသည်။
သင်လိုချင်သော အရွယ်အစားအတိအကျရှိသော histogram တစ်ခုကို ဖန်တီးရန် ပုံဆောင်အရွယ်အစား အငြင်းအခုံ၏ တန်ဖိုးများနှင့် ကစားရန် လွတ်လွတ်လပ်လပ် ခံစားလိုက်ပါ။
ထပ်လောင်းအရင်းအမြစ်များ
အောက်ဖော်ပြပါ သင်ခန်းစာများသည် ပန်ဒါများတွင် အခြားဘုံအလုပ်များကို မည်သို့လုပ်ဆောင်ရမည်ကို ရှင်းပြသည်-
Pandas DataFrame မှ histogram တစ်ခုဖန်တီးနည်း
Pandas စီးရီးမှ histogram တစ်ခုကို ဖန်တီးနည်း
Pandas တွင် အုပ်စုအလိုက် ဟီစတိုဂရမ်များကို မည်သို့ဆွဲမည်နည်း။
စာရေးသူအကြောင်း
Benjamin Anderson
မင်္ဂလာပါ၊ ကျွန်ုပ်သည် အငြိမ်းစား စာရင်းအင်း ပါမောက္ခ ဘင်ဂျမင်ဖြစ်ပြီး သီးသန့် Statorials ဆရာအဖြစ် လှည့်ပတ်ပါသည်။ စာရင်းဇယားနယ်ပယ်တွင် ကျယ်ပြန့်သောအတွေ့အကြုံနှင့် ကျွမ်းကျင်မှုနှင့်အတူ၊ Statorials မှတစ်ဆင့် ကျောင်းသားများကို ခွန်အားဖြစ်စေရန်အတွက် ကျွန်ုပ်၏အသိပညာကို မျှဝေလိုပါသည်။ ပိုသိတယ်။