Pandas histogram ရှိ x ဝင်ရိုးအကွာအဝေးကို ဘယ်လိုပြောင်းမလဲ။
pandas histogram တွင် x-axis ၏အကွာအဝေးကိုပြောင်းလဲရန် range argument ကိုသုံးနိုင်သည်။
plt. hist (df[' var1 '], range=[ 10 , 30 ])
ဤဥပမာတွင်၊ ကျွန်ုပ်တို့သည် x-axis ကို 10 နှင့် 30 အကြားသတ်မှတ်ထားသည်။
အောက်ဖော်ပြပါ ဥပမာသည် အပိုင်းအခြား အငြင်းအခုံကို လက်တွေ့တွင် အသုံးပြုနည်းကို ပြသထားသည်။
ဥပမာ- Pandas Histogram ရှိ X Axis အကွာအဝေးကို ပြောင်းလဲခြင်း။
ကျွန်ုပ်တို့တွင် အောက်ပါ ပန်ဒါ DataFrame ရှိသည် ဆိုပါစို့။
 import pandas as pd
import numpy as np

#make this example reproducible
n.p. random . seeds (1)

#createDataFrame
df = pd. DataFrame ({' team ': np.repeat ([' A ',' B ',' C '], 100 ),
                   ' points ': np. random . normal (loc= 20 , scale= 2 , size= 300 )})

#view head of DataFrame
print ( df.head ())

  team points
0 A 23.248691
1 A 18.776487
2 A 18.943656
3 A 17.854063
4 A 21.730815
အကယ်၍ ကျွန်ုပ်တို့သည် ကိန်းရှင် အမှတ်များအတွက် ဟီစတိုဂရမ်တစ်ခုကို ဖန်တီးပါက၊ ပန်ဒါများသည် အ နိ မ့်ဆုံးနှင့် အမြင့်ဆုံးတန်ဖိုးများပေါ်တွင် အခြေခံ၍ ပန်ဒါများသည် x-axis အပိုင်းအခြားကို အလိုအလျောက်ရွေးချယ်လိမ့်မည်-
 import matplotlib.pyplot as plt

#create histogram for variable points
plt. hist (df[' points '], edgecolor=' black ')
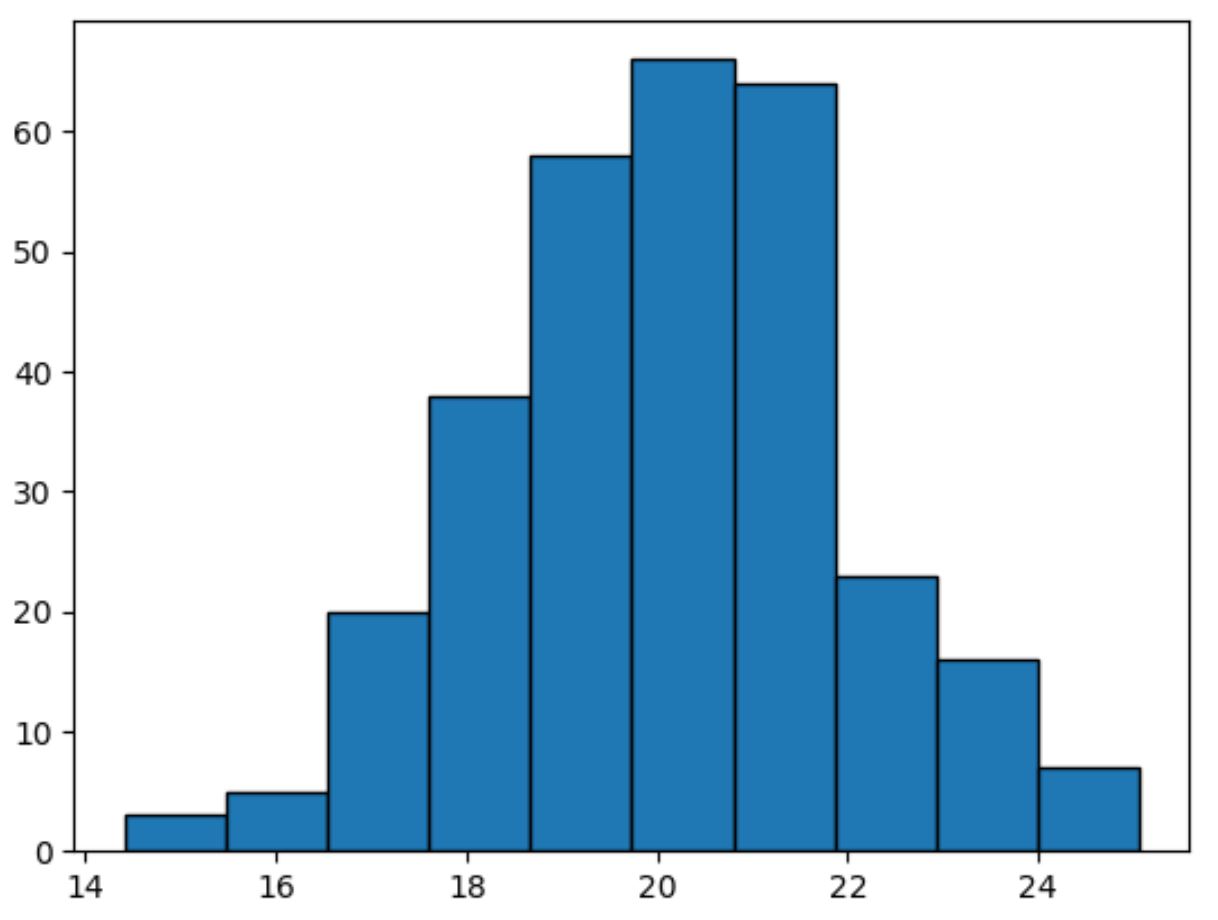
x-axis သည် 14 မှ 25 အထိဖြစ်သည်။
အ နိမ့်ဆုံးနှင့် အမြင့်ဆုံးတန်ဖိုးများကိုပြသရန် describe() လုပ်ဆောင်ချက်ကို ကျွန်ုပ်တို့အသုံးပြုနိုင်သည်-
 #summarize distribution of points variable
df[' points ']. describe ()

count 300.000000
mean 20.148800
std 1.890841
min 14.413830
25% 18.818254
50% 20.176352
75% 21.372843
max 25.056651
Name: points, dtype: float64
အနိမ့်ဆုံးတန်ဖိုးမှာ 14.41 ဖြစ်ပြီး အမြင့်ဆုံးတန်ဖိုးမှာ 25.06 ဖြစ်ပြီး လက်ရှိဇယားရှိ x-axis သည် 14 မှ 25 ထိ အဘယ်ကြောင့်ကွာသည်ကို ရှင်းပြသည်။
သို့သော်၊ ကျွန်ုပ်တို့သည် x-axis ကို 10 မှ 30 သို့သွားစေရန် အပိုင်းအခြား အငြင်းအခုံကိုသုံးနိုင်သည်။
 import matplotlib.pyplot as plt

#create histogram for points variable with custom x-axis range
plt. hist (df[' points '], edgecolor=' black ', range=[ 10 , 30 ])
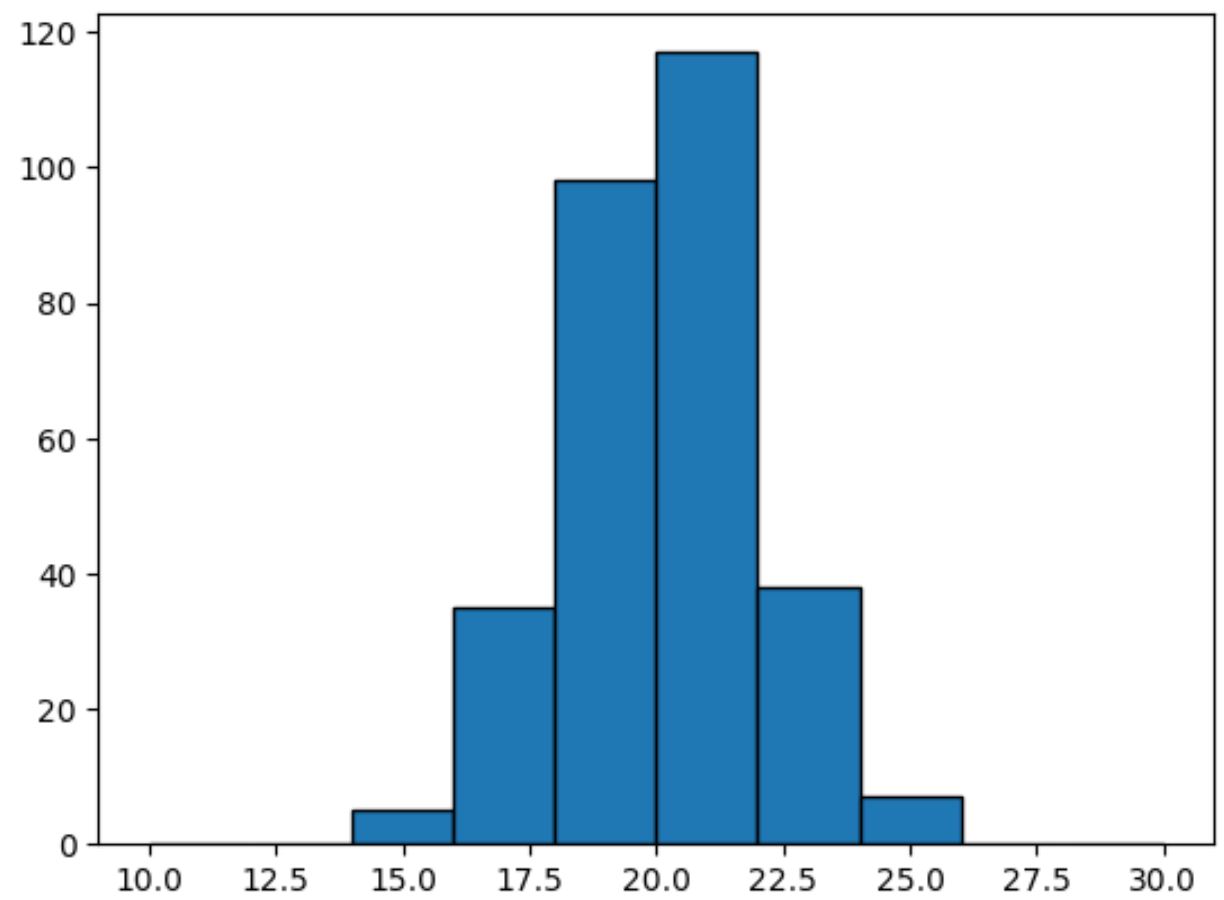
ယခု X axis သည် 10 မှ 30 အထိရှိနေသည်ကို သတိပြုပါ။
ထပ်လောင်းအရင်းအမြစ်များ
အောက်ဖော်ပြပါ သင်ခန်းစာများသည် အခြားဘုံပန်ဒါတာဝန်များကို မည်သို့လုပ်ဆောင်ရမည်ကို ရှင်းပြသည်-
Pandas DataFrame မှ histogram တစ်ခုဖန်တီးနည်း
Pandas စီးရီးမှ histogram တစ်ခုကို ဖန်တီးနည်း
Pandas တွင် အုပ်စုအလိုက် ဟီစတိုဂရမ်ပုံဆွဲနည်း
စာရေးသူအကြောင်း
Benjamin Anderson
မင်္ဂလာပါ၊ ကျွန်ုပ်သည် အငြိမ်းစား စာရင်းအင်း ပါမောက္ခ ဘင်ဂျမင်ဖြစ်ပြီး သီးသန့် Statorials ဆရာအဖြစ် လှည့်ပတ်ပါသည်။ စာရင်းဇယားနယ်ပယ်တွင် ကျယ်ပြန့်သောအတွေ့အကြုံနှင့် ကျွမ်းကျင်မှုနှင့်အတူ၊ Statorials မှတစ်ဆင့် ကျောင်းသားများကို ခွန်အားဖြစ်စေရန်အတွက် ကျွန်ုပ်၏အသိပညာကို မျှဝေလိုပါသည်။ ပိုသိတယ်။