Python ရှိ ဒေတာစာရင်းမှ ဟီစတိုဂရမ်တစ်ခုကို ဘယ်လိုဆွဲမလဲ။
Python ရှိ ဒေတာစာရင်းမှ ဟီစတိုဂရမ်တစ်ခုကို ဆွဲရန် အောက်ပါအခြေခံအထားအသိုကိုသုံးနိုင်သည်။
 import matplotlib. pyplot as plt

#create list of data
x = [2, 4, 4, 5, 6, 6, 7, 8, 14]

#create histogram from list of data
plt. hist (x,bins= 4 )
အောက်ပါဥပမာများသည် ဤ syntax ကိုလက်တွေ့တွင်မည်သို့အသုံးပြုရမည်ကိုပြသထားသည်။
ဥပမာ 1- ပုံသေ bins အရေအတွက်ဖြင့် histogram တစ်ခုကို ဖန်တီးပါ။
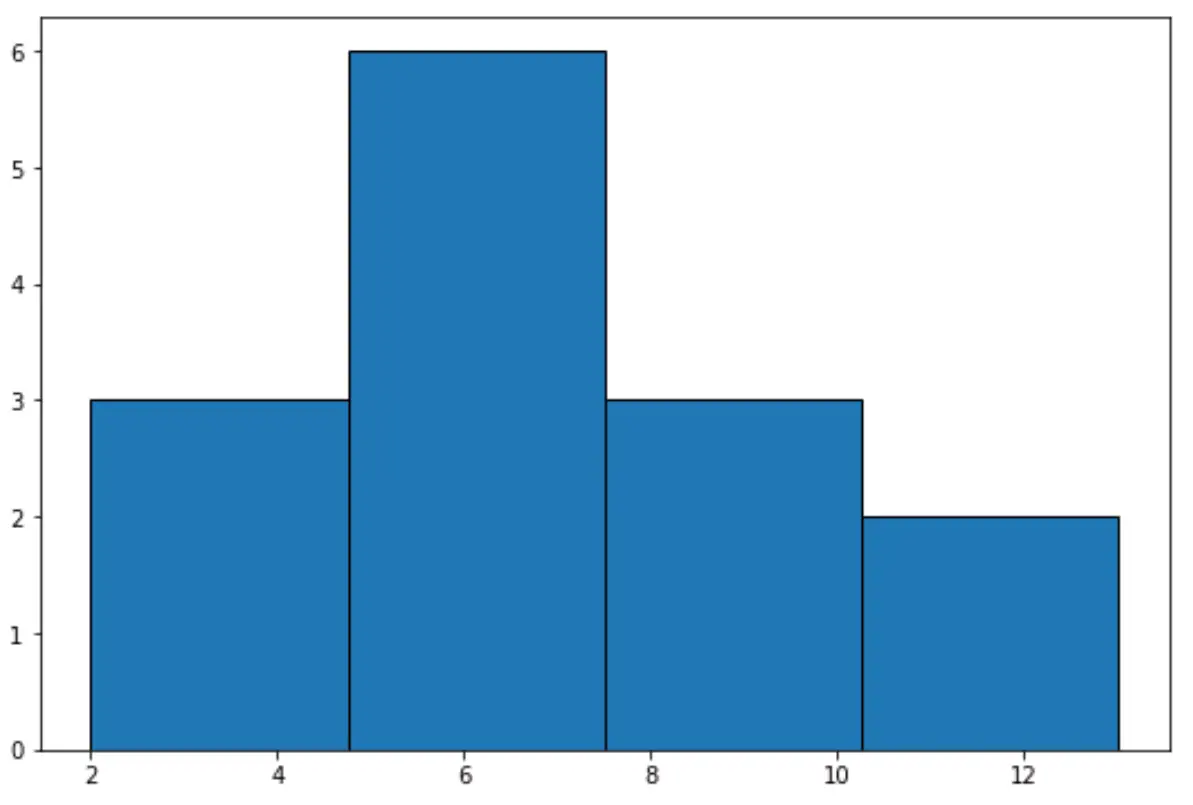
အောက်ဖော်ပြပါကုဒ်သည် သတ်မှတ်ထားသော အကွက်အရေအတွက်ကို အသုံးပြု၍ ဒေတာစာရင်းမှ ဟီစတိုဂရမ်တစ်ခုကို ဖန်တီးနည်းကို ပြသသည်-
 import matplotlib. pyplot as plt

#create list of data
x = [2, 4, 4, 5, 6, 6, 7, 7, 7, 8, 8, 8, 12, 13]

#create histogram with 4 bins
plt. hist (x, bins= 4 , edgecolor=' black ')
ဥပမာ 2- သတ်မှတ်ထားသော bin အပိုင်းအခြားများဖြင့် histogram တစ်ခုကို ဖန်တီးပါ။
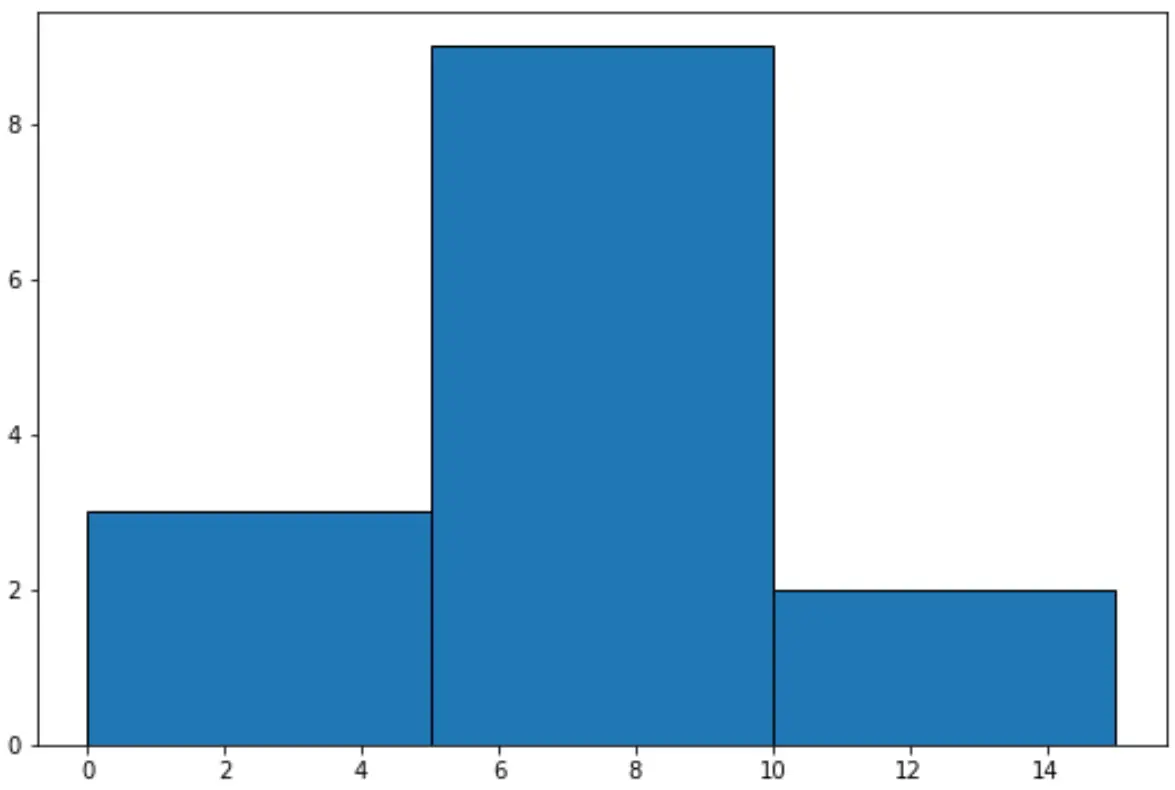
ဖော်ပြပါကုဒ်သည် သတ်မှတ်ထားသော အကွက်အပိုင်းအခြားများကို အသုံးပြု၍ ဒေတာစာရင်းမှ ဟီစတိုဂရမ်တစ်ခုကို ဖန်တီးနည်းကို ပြသသည်-
 import matplotlib. pyplot as plt

#create list of data
x = [2, 4, 4, 5, 6, 6, 7, 7, 7, 8, 8, 8, 12, 13]

#specify bin start and end points
bin_ranges = [0, 5, 10, 15]

#create histogram with 4 bins
plt. hist (x, bins=bin_ranges, edgecolor=' black ')
Matplotlib histogram လုပ်ဆောင်ချက်၏ စာရွက်စာတမ်းအပြည့်အစုံကို ဤနေရာတွင် ရှာဖွေနိုင်ပါသည်။
ထပ်လောင်းအရင်းအမြစ်များ
Matplotlib တွင် အခြားသော အသုံးများသော ဇယားကွက်များ ဖန်တီးနည်းကို အောက်ပါ သင်ခန်းစာများက ရှင်းပြသည် ။
Matplotlib တွင် အချိန်စီးရီးတစ်ခုကို ဘယ်လိုဆွဲမလဲ။
Matplotlib တွင် အုပ်စုအလိုက် boxplots ဖန်တီးနည်း
Matplotlib တွင် ကွက်ကွက်အရွယ်အစားကို မည်သို့တိုးမည်နည်း။
စာရေးသူအကြောင်း
Benjamin Anderson
မင်္ဂလာပါ၊ ကျွန်ုပ်သည် အငြိမ်းစား စာရင်းအင်း ပါမောက္ခ ဘင်ဂျမင်ဖြစ်ပြီး သီးသန့် Statorials ဆရာအဖြစ် လှည့်ပတ်ပါသည်။ စာရင်းဇယားနယ်ပယ်တွင် ကျယ်ပြန့်သောအတွေ့အကြုံနှင့် ကျွမ်းကျင်မှုနှင့်အတူ၊ Statorials မှတစ်ဆင့် ကျောင်းသားများကို ခွန်အားဖြစ်စေရန်အတွက် ကျွန်ုပ်၏အသိပညာကို မျှဝေလိုပါသည်။ ပိုသိတယ်။