Python တွင် sigmoid function ကို တွက်ချက်နည်း (ဥပမာများဖြင့်)
sigmoid လုပ်ဆောင်ချက် သည် ပုံဖော်သည့်အခါ “ S” ပုံသဏ္ဍာန်မျဉ်းကွေးကို ပြသသည့် သင်္ချာလုပ်ဆောင်ချက်တစ်ခုဖြစ်သည်။
sigmoid လုပ်ဆောင်ချက်၏ အသုံးအများဆုံး ဥပမာမှာ အောက်ပါအတိုင်း တွက်ချက်ထားသည့် logistic sigmoid function ဖြစ်သည်။
F(x) = 1 / (1 + e -x )
Python ရှိ sigmoid လုပ်ဆောင်ချက်ကို တွက်ချက်ရန် အလွယ်ကူဆုံးနည်းလမ်းမှာ အောက်ပါအခြေခံ syntax ကိုအသုံးပြုထားသည့် SciPy စာကြည့်တိုက်မှ expit() လုပ်ဆောင်ချက်ကို အသုံးပြုရန်ဖြစ်သည်။
 from scipy. special import expit

#calculate sigmoid function for x = 2.5
expire(2.5)
အောက်ဖော်ပြပါ ဥပမာများသည် ဤလုပ်ဆောင်ချက်ကို လက်တွေ့အသုံးချနည်းကို ပြသထားသည်။
ဥပမာ 1- တန်ဖိုးတစ်ခုအတွက် sigmoid လုပ်ဆောင်ချက်ကို တွက်ချက်ပါ။
အောက်ပါကုဒ်သည် တန်ဖိုး x = 2.5 အတွက် sigmoid လုပ်ဆောင်ချက်ကို တွက်ချက်နည်းကို ပြသည်-
 from scipy. special import expit

#calculate sigmoid function for x = 2.5
expire(2.5)

0.9241418199787566
x = 2.5 အတွက် sigmoid လုပ်ဆောင်ချက်၏ တန်ဖိုးသည် 0.924 ဖြစ်သည်။
တန်ဖိုးကို ကိုယ်တိုင် တွက်ချက်ခြင်းဖြင့် ၎င်းကို အတည်ပြုနိုင်သည်-
- F(x) = 1 / (1 + e -x )
- F(x) = 1 / (1 + e -2.5 )
- F(x) = 1 / (1 + 0.082)
- F(x) = 0.924
ဥပမာ 2- တန်ဖိုးများစွာအတွက် Sigmoid Function ကို တွက်ချက်ပါ။
အောက်ပါကုဒ်သည် x တန်ဖိုးများစွာအတွက် sigmoid လုပ်ဆောင်ချက်ကို တစ်ကြိမ်တည်းတွက်ချက်နည်းကို ပြသသည်-
 from scipy. special import expit

#define list of values
values = [-2, -1, 0, 1, 2]

#calculate sigmoid function for each value in list
expire(values)

array([0.11920292, 0.26894142, 0.5, 0.73105858, 0.88079708])
ဥပမာ 3- တန်ဖိုးများအကွာအဝေးအတွက် Sigmoid Function ကို စီစဉ်ခြင်း။
အောက်ပါကုဒ်သည် matplotlib ကို အသုံးပြု၍ တန်ဖိုးများ x အကွာအဝေးအတွက် sigmoid လုပ်ဆောင်ချက်တစ်ခု၏ တန်ဖိုးများကို ပုံဖော်နည်းကို ပြသသည် ။
 import matplotlib. pyplot as plt
from scipy. special import expit
import numpy as np

#define range of x-values
x = np. linspace (-10, 10, 100)

#calculate sigmoid function for each x-value
y = expire(x)

#createplot
plt. plot (x, y)
plt. xlabel (' x ')
plt. ylabel (' F(x) ')

#displayplot
plt. show ()
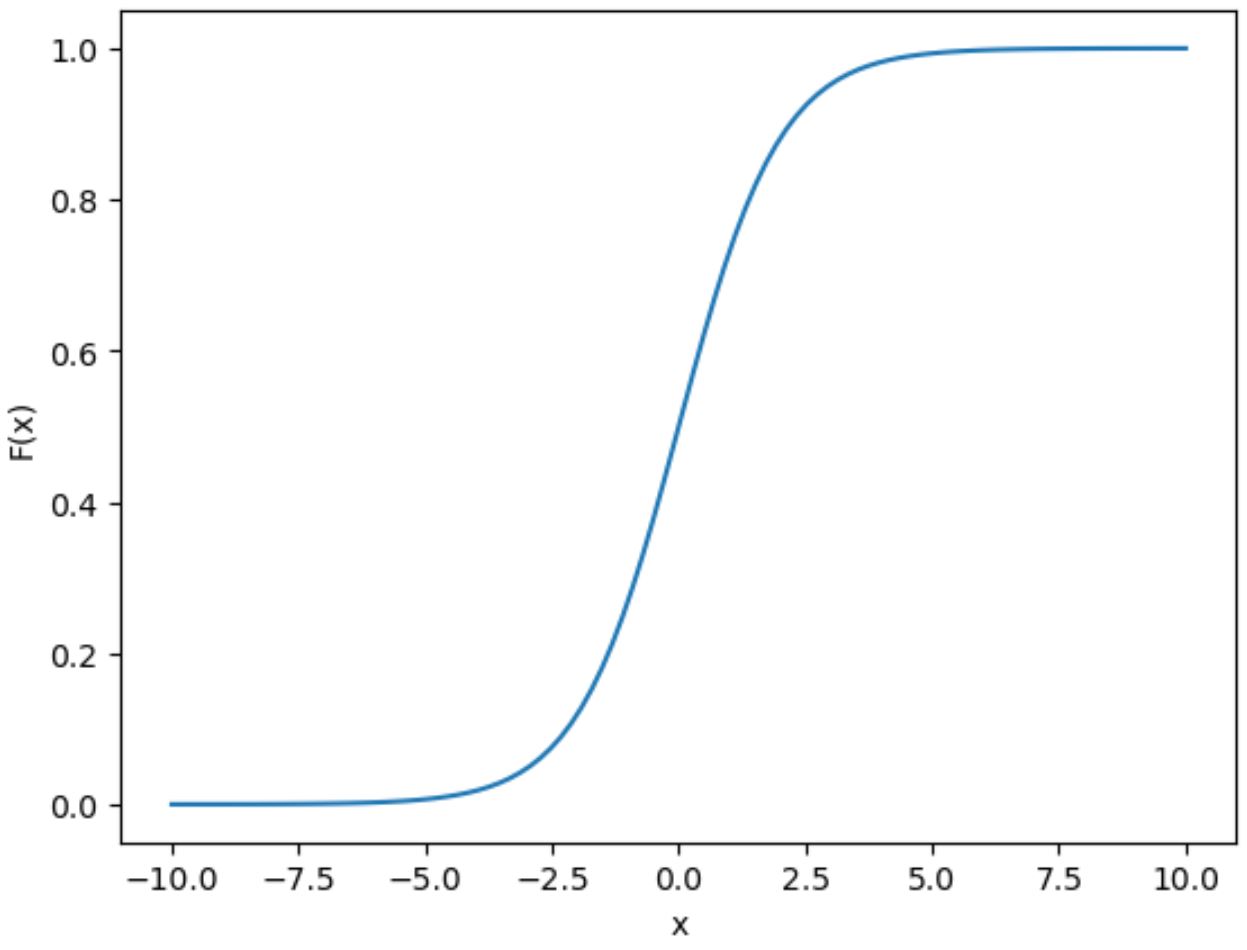
ကွက်ကွက်သည် sigmoid လုပ်ဆောင်ချက်၏ “S” ပုံသဏ္ဍာန်မျဉ်းကွေးကို ပြသသည်ကို သတိပြုပါ။
ထပ်လောင်းအရင်းအမြစ်များ
အောက်ပါ သင်ခန်းစာများသည် Python တွင် အခြားသော ဘုံလုပ်ဆောင်ချက်များကို မည်သို့လုပ်ဆောင်ရမည်ကို ရှင်းပြသည်-
Python တွင် Logistic Regression ကို မည်သို့လုပ်ဆောင်မည်နည်း။
Python တွင် logistic regression curve ကို ဘယ်လိုဆွဲမလဲ။
စာရေးသူအကြောင်း
Benjamin Anderson
မင်္ဂလာပါ၊ ကျွန်ုပ်သည် အငြိမ်းစား စာရင်းအင်း ပါမောက္ခ ဘင်ဂျမင်ဖြစ်ပြီး သီးသန့် Statorials ဆရာအဖြစ် လှည့်ပတ်ပါသည်။ စာရင်းဇယားနယ်ပယ်တွင် ကျယ်ပြန့်သောအတွေ့အကြုံနှင့် ကျွမ်းကျင်မှုနှင့်အတူ၊ Statorials မှတစ်ဆင့် ကျောင်းသားများကို ခွန်အားဖြစ်စေရန်အတွက် ကျွန်ုပ်၏အသိပညာကို မျှဝေလိုပါသည်။ ပိုသိတယ်။