Python တွင် gamma distribution ကို ဘယ်လိုဆွဲမလဲ (ဥပမာများဖြင့်)
စာရင်းဇယားများတွင်၊ Gamma ဖြန့်ဝေမှုကို စောင့်ဆိုင်းချိန်နှင့် ပတ်သက်သော ဖြစ်နိုင်ခြေများကို နမူနာအဖြစ် အသုံးပြုလေ့ရှိသည်။
အောက်ပါနမူနာများသည် Python တွင် တစ်ခု သို့မဟုတ် တစ်ခုထက်ပိုသော Gamma ဖြန့်ဝေမှုများကို ကြံစည်ရန် scipy.stats.gamma() လုပ်ဆောင်ချက်ကို အသုံးပြုနည်းကို ပြသထားသည်။
ဥပမာ 1- Gamma ဖြန့်ဝေမှုကို ကြံစည်ခြင်း။
အောက်ပါ ကုဒ်သည် ပုံသဏ္ဍာန် ဘောင် 5 နှင့် Python တွင် 3 ၏ ပုံသဏ္ဍာန် ဘောင်တစ်ခုပါရှိသော Gamma ဖြန့်ဝေပုံကို ကြံစည်ပုံကို ပြသည်-
 import numpy as np
import scipy. stats as stats
import matplotlib. pyplot as plt

#define x-axis values
x = np. linspace (0, 40, 100)

#calculate pdf of Gamma distribution for each x-value
y = stats. gamma . pdf (x, a= 5 , scale= 3 )

#create plot of Gamma distribution
plt. plot (x, y)

#displayplot
plt. show ()
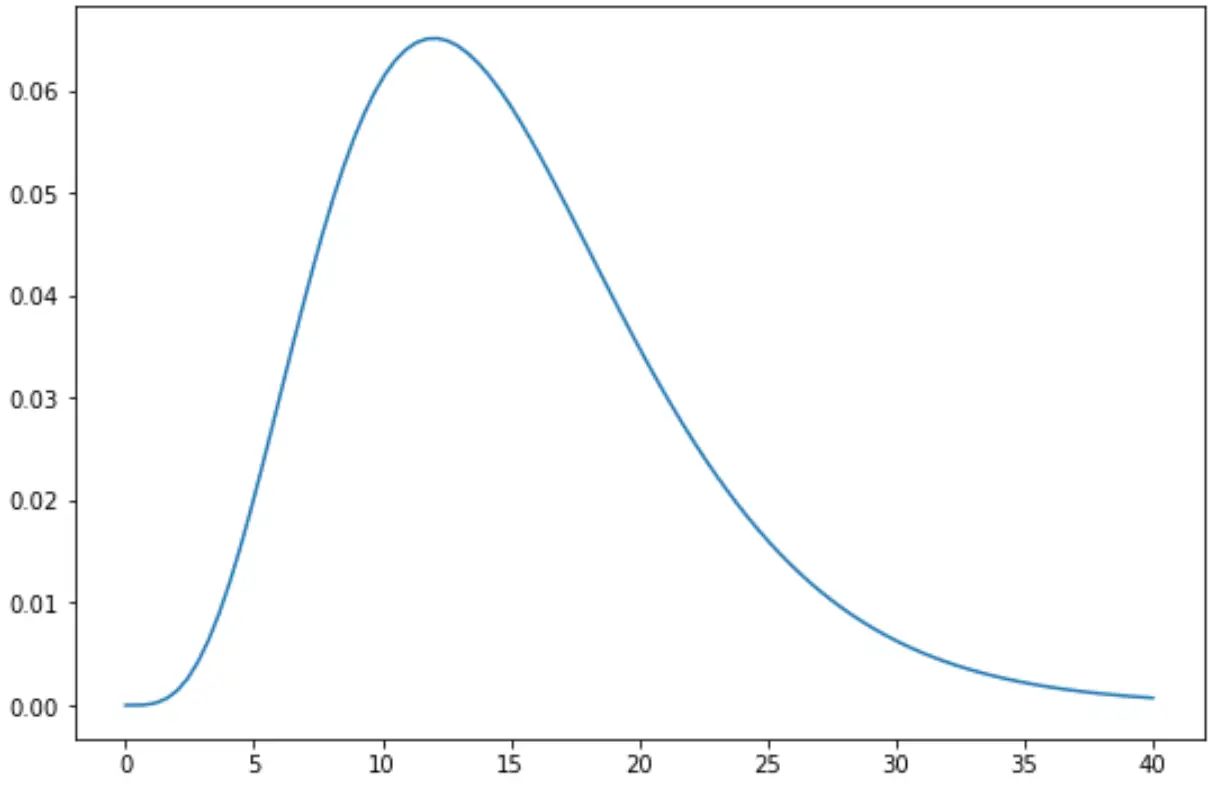
x-axis သည် Gamma ဖြန့်ဝေထားသော ကျပန်းကွဲလွဲချက်တစ်ခုယူနိုင်သည့် အလားအလာတန်ဖိုးများကိုပြသပြီး y-axis သည် Gamma ဖြန့်ဝေမှု၏ သက်ဆိုင်သော PDF တန်ဖိုးများကို 5 ပုံသဏ္ဍာန်ဘောင်မီတာ 3 နှင့် စကေးဘောင်တစ်ခုဖြင့် ပြသသည်။
ဥပမာ 2- Gamma အများအပြားဖြန့်ဝေမှုများကို စီစဉ်ခြင်း။
အောက်ဖော်ပြပါ ကုဒ်သည် မတူညီသော ပုံသဏ္ဍာန်နှင့် အတိုင်းအတာ ကန့်သတ်ချက်များဖြင့် များစွာသော Gamma ဖြန့်ဝေမှုများကို မည်သို့စီစဉ်ရမည်ကို ပြသသည်-
 import numpy as np
import scipy. stats as stats
import matplotlib. pyplot as plt

#define three Gamma distributions
x = np. linspace (0, 40, 100)
y1 = stats. gamma . pdf (x, a= 5 , scale= 3 )
y2 = stats. gamma . pdf (x, a= 2 , scale= 5 )
y3 = stats. gamma . pdf (x, a= 4 , scale= 2 )

#add lines for each distribution
plt. plot (x, y1, label= shape=5, scale=3 ')
plt. plot (x, y2, label=' shape=2, scale=5 ')
plt. plot (x, y3, label=' shape=4, scale=2 ')

#add legend
plt. legend ()

#displayplot
plt. show ()
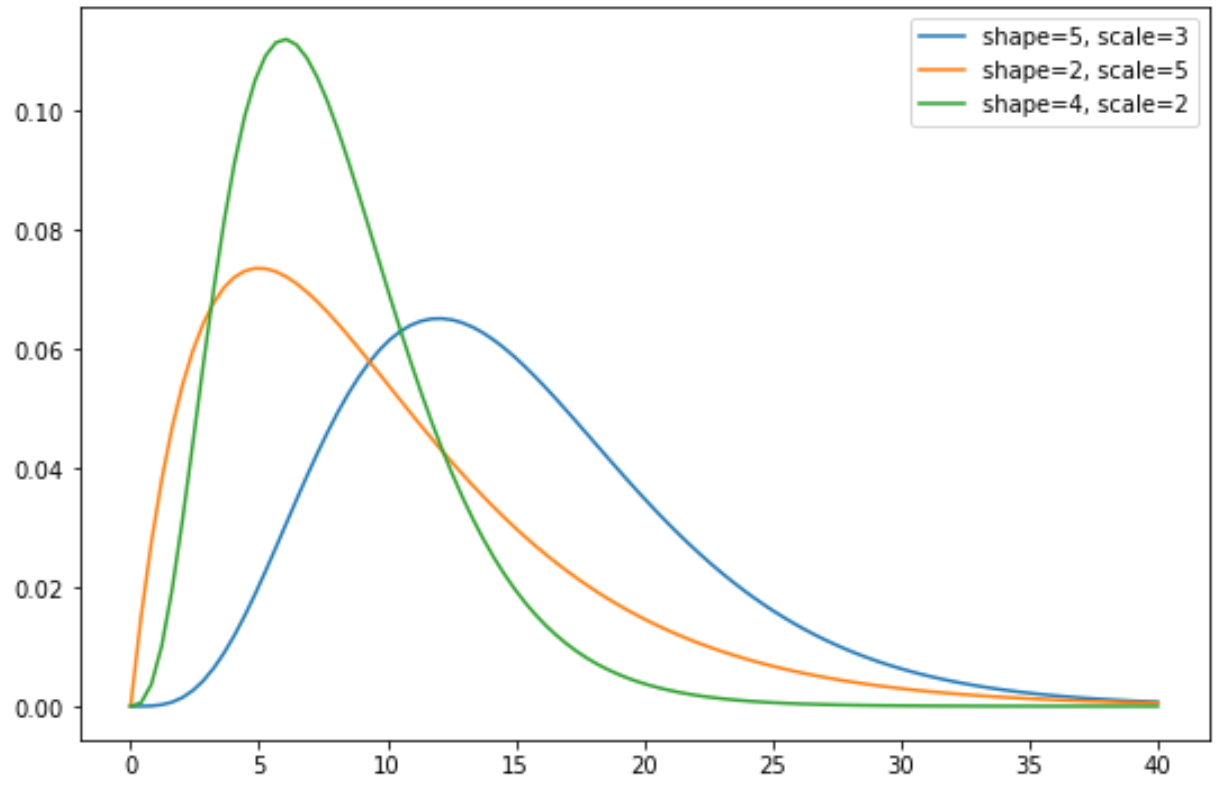
Gamma ဖြန့်ဖြူးမှု၏ ပုံသဏ္ဍာန်သည် ပုံသဏ္ဍာန်နှင့် အတိုင်းအတာ ဘောင်များပေါ်မူတည်၍ သိသိသာသာ ကွဲပြားနိုင်ကြောင်း သတိပြုပါ။
ဆက်စပ်- Matplotlib တွင် မျဉ်းများစွာကို ဘယ်လိုဆွဲမလဲ။
ထပ်လောင်းအရင်းအမြစ်များ
အောက်ပါ သင်ခန်းစာများသည် Python တွင် အခြားသော ဘုံဖြန့်ဝေမှုများကို မည်ကဲ့သို့ ဆွဲရမည်ကို ရှင်းပြသည်-
Python တွင် ပုံမှန်ဖြန့်ဝေနည်းကို ရေးဆွဲနည်း
Python တွင် chi-square ဖြန့်ချီပုံကို ဘယ်လိုဆွဲမလဲ။
စာရေးသူအကြောင်း
Benjamin Anderson
မင်္ဂလာပါ၊ ကျွန်ုပ်သည် အငြိမ်းစား စာရင်းအင်း ပါမောက္ခ ဘင်ဂျမင်ဖြစ်ပြီး သီးသန့် Statorials ဆရာအဖြစ် လှည့်ပတ်ပါသည်။ စာရင်းဇယားနယ်ပယ်တွင် ကျယ်ပြန့်သောအတွေ့အကြုံနှင့် ကျွမ်းကျင်မှုနှင့်အတူ၊ Statorials မှတစ်ဆင့် ကျောင်းသားများကို ခွန်အားဖြစ်စေရန်အတွက် ကျွန်ုပ်၏အသိပညာကို မျှဝေလိုပါသည်။ ပိုသိတယ်။