Python တွင် အရေအတွက် ပမာဏ ဆုတ်ယုတ်မှု လုပ်ဆောင်နည်း
Linear regression သည် တစ်ခု သို့မဟုတ် တစ်ခုထက်ပိုသော ကြိုတင်ခန့်မှန်းကိန်းရှင်များနှင့် တုံ့ပြန်မှုကိန်းရှင် အကြား ဆက်နွယ်မှုကို နားလည်ရန် ကျွန်ုပ်တို့ အသုံးပြုနိုင်သည့် နည်းလမ်းတစ်ခုဖြစ်သည်။
ပုံမှန်အားဖြင့်၊ ကျွန်ုပ်တို့သည် linear regression လုပ်ဆောင်သောအခါ၊ တုံ့ပြန်မှုကိန်းရှင်၏ ပျမ်းမျှတန်ဖိုးကို ခန့်မှန်းလိုပါသည်။
သို့သော်၊ ကျွန်ုပ်တို့သည် တုံ့ပြန်မှုတန်ဖိုး၏ ပမာဏ သို့မဟုတ် ရာခိုင်နှုန်းတန်ဖိုး၊ 70th ရာခိုင်နှုန်း၊ 90th ရာခိုင်နှုန်း၊ 98th ရာခိုင်နှုန်းစသည်ဖြင့် ခန့်မှန်းရန် quantile regression ဟုခေါ်သော နည်းလမ်းကို အသုံးပြုနိုင်သည်။
ဤသင်ခန်းစာသည် Python တွင် ပမာဏဆုတ်ယုတ်မှုလုပ်ဆောင်ရန် ဤလုပ်ဆောင်ချက်ကိုအသုံးပြုပုံအဆင့်ဆင့်ကို ဥပမာပေးထားသည်။
အဆင့် 1- လိုအပ်သော ပက်ကေ့ခ်ျများကို တင်ပါ။
ပထမဦးစွာ ကျွန်ုပ်တို့သည် လိုအပ်သော ပက်ကေ့ဂျ်များနှင့် လုပ်ဆောင်ချက်များကို တင်ပေးပါမည်။
 import numpy as np
import pandas as pd
import statsmodels. api as sm
import statsmodels. formula . api as smf
import matplotlib. pyplot as plt
အဆင့် 2: ဒေတာကိုဖန်တီးပါ။
ဤဥပမာအတွက်၊ တက္ကသိုလ်တစ်ခုရှိ ကျောင်းသား 100 အတွက် ရရှိသော နာရီများနှင့် စာမေးပွဲရလဒ်များပါဝင်သော ဒေတာအတွဲတစ်ခုကို ကျွန်ုပ်တို့ ဖန်တီးပါမည်။
 #make this example reproducible
n.p. random . seeds (0)

#create dataset
obs = 100

hours = np. random . uniform (1, 10, obs)
score = 60 + 2*hours + np. random . normal (loc=0, scale=.45*hours, size=100)

df = pd. DataFrame ({' hours ':hours, ' score ':score})

#view first five rows
df. head ()

hours score
0 5.939322 68.764553
1 7.436704 77.888040
2 6.424870 74.196060
3 5.903949 67.726441
4 4.812893 72.849046
အဆင့် 3- Quantile Regression လုပ်ဆောင်ပါ။
ဆက်လက်၍၊ ကျွန်ုပ်တို့သည် ကြိုတင်ခန့်မှန်းကိန်းရှင်ကိန်းရှင်နှင့် တုံ့ပြန်မှုကိန်းရှင်အဖြစ် စာမေးပွဲရမှတ်များအဖြစ် လေ့လာထားသော နာရီများကို အသုံးပြု၍ အရေအတွက် ဆုတ်ယုတ်မှုပုံစံကို ဖြည့်သွင်းပါမည်။
လေ့လာခဲ့သည့် နာရီအရေအတွက်ပေါ်မူတည်၍ မျှော်မှန်းထားသည့် 90th ရာခိုင်နှုန်း စာမေးပွဲရမှတ်များကို ခန့်မှန်းရန် မော်ဒယ်ကို အသုံးပြုပါမည်။
 #fit the model
model = smf. quantreg ('score~hours', df). fit (q= 0.9 )

#view model summary
print ( model.summary ())

                         QuantReg Regression Results
==================================================== ============================
Dept. Variable: Pseudo R-squared score: 0.6057
Model: QuantReg Bandwidth: 3.822
Method: Least Squares Sparsity: 10.85
Date: Tue, 29 Dec 2020 No. Observations: 100
Time: 15:41:44 Df Residuals: 98
                                        Model: 1
==================================================== ============================
                 coef std err t P>|t| [0.025 0.975]
-------------------------------------------------- ----------------------------
Intercept 59.6104 0.748 79.702 0.000 58.126 61.095
hours 2.8495 0.128 22.303 0.000 2.596 3.103
==================================================== ============================
ရလဒ်မှ ခန့်မှန်းခြေ ဆုတ်ယုတ်မှုညီမျှခြင်းကို ကျွန်ုပ်တို့ မြင်နိုင်သည်-
90th ရာခိုင်နှုန်း စာမေးပွဲရမှတ် = 59.6104 + 2.8495*(နာရီ)
ဥပမာအားဖြင့်၊ 8 နာရီစာလေ့လာသောကျောင်းသားအားလုံး၏ 90th ရာခိုင်နှုန်းရမှတ်သည် 82.4 ဖြစ်သင့်သည်-
၉၀ မြောက် စာမေးပွဲရမှတ် = 59.6104 + 2.8495*(8) = 82.4 ။
အထွက်သည် ခန့်မှန်းသူကိန်းရှင်၏ ကြားဖြတ်နှင့် အချိန်များအတွက် အပေါ်နှင့်အောက် ယုံကြည်မှုကန့်သတ်ချက်များကိုလည်း ပြသသည်။
အဆင့် 4- ရလဒ်များကို မြင်ယောင်ကြည့်ပါ။
ဂရပ်ပေါ်တွင် တပ်ဆင်ထားသော အရေအတွက် ဆုတ်ယုတ်မှုညီမျှခြင်းနှင့်အတူ ခွဲခြမ်းစိပ်ဖြာမှုတစ်ခုကို ဖန်တီးခြင်းဖြင့် ဆုတ်ယုတ်မှုရလဒ်များကို မြင်ယောင်ကြည့်နိုင်သည်-
 #define figure and axis
fig, ax = plt.subplots(figsize=(8, 6))

#get y values
get_y = lambda a, b: a + b * hours
y = get_y( model.params [' Intercept '], model.params [' hours '])

#plot data points with quantile regression equation overlaid
ax. plot (hours, y, color=' black ')
ax. scatter (hours, score, alpha=.3)
ax. set_xlabel (' Hours Studied ', fontsize=14)
ax. set_ylabel (' Exam Score ', fontsize=14)
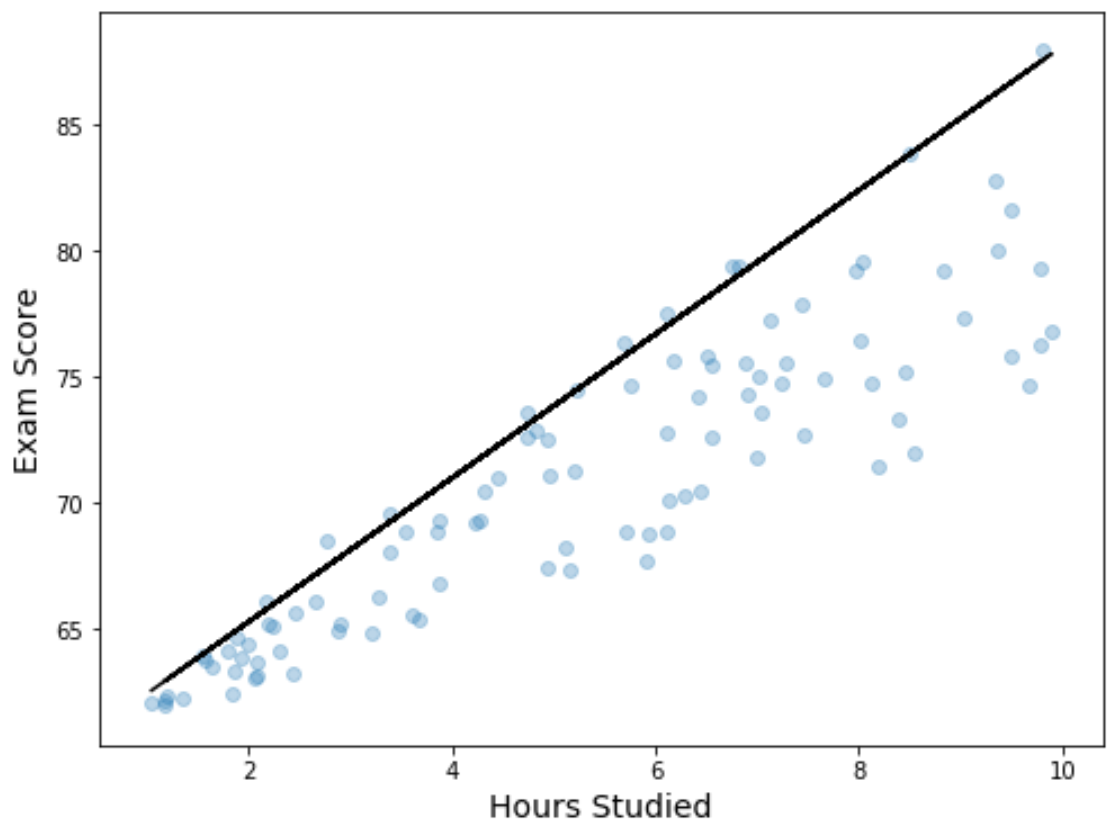
ရိုးရှင်းသော linear regression line နှင့်မတူဘဲ၊ ဤ fitted line သည် data အတွက် “ အသင့်တော်ဆုံး line” ကို ကိုယ်စားမပြုကြောင်း သတိပြုပါ။ ယင်းအစား၊ ၎င်းသည် ခန့်မှန်းသူကိန်းရှင်အဆင့်တစ်ခုစီတွင် ခန့်မှန်းခြေ 90th ရာခိုင်နှုန်းကို ဖြတ်သန်းသွားမည်ဖြစ်သည်။
ထပ်လောင်းအရင်းအမြစ်များ
Python တွင် ရိုးရှင်းသော linear regression လုပ်နည်း
Python တွင် quadratic regression လုပ်ဆောင်နည်း
စာရေးသူအကြောင်း
Benjamin Anderson
မင်္ဂလာပါ၊ ကျွန်ုပ်သည် အငြိမ်းစား စာရင်းအင်း ပါမောက္ခ ဘင်ဂျမင်ဖြစ်ပြီး သီးသန့် Statorials ဆရာအဖြစ် လှည့်ပတ်ပါသည်။ စာရင်းဇယားနယ်ပယ်တွင် ကျယ်ပြန့်သောအတွေ့အကြုံနှင့် ကျွမ်းကျင်မှုနှင့်အတူ၊ Statorials မှတစ်ဆင့် ကျောင်းသားများကို ခွန်အားဖြစ်စေရန်အတွက် ကျွန်ုပ်၏အသိပညာကို မျှဝေလိုပါသည်။ ပိုသိတယ်။