Python တွင် time series data ကို နမူနာယူနည်း (ဥပမာများဖြင့်)
အချိန်စီးရီးဒေတာကို ပြန်လည်နမူနာယူခြင်း ဆိုသည်မှာ ကာလအသစ်တစ်ခုအတွင်း ဒေတာကို အကျဉ်းချုပ် သို့မဟုတ် ပေါင်းစည်းခြင်းဆိုလိုသည်။
Python တွင် အချိန်စီးရီးဒေတာကို ပြန်လည်နမူနာပြုလုပ်ရန် အောက်ပါအခြေခံ syntax ကို အသုံးပြုနိုင်ပါသည်။
 #find sum of values in column1 by month
weekly_df[' column1 '] = df[' column1 ']. resample (' M '). sum ()

#find mean of values in column1 by week
weekly_df[' column1 '] = df[' column1 ']. resample (' W '). mean ()
အချိန်စီးရီးဒေတာကို မတူညီသောအချိန်ကာလများအပါအဝင်၊
- S : စက္ကန့်
- မိနစ် : မိနစ်
- H : နာရီ
- J : နေ့
- W : ရက်သတ္တပတ်
- M : လ
- Q : ရပ်ကွက်
- A : နှစ်
အောက်ဖော်ပြပါ ဥပမာသည် လက်တွေ့တွင် အချိန်စီးရီးဒေတာကို မည်ကဲ့သို့ ပုံသက်သေပြရမည်ကို ပြသထားသည်။
ဥပမာ- Python ရှိ Time Series ဒေတာကို နမူနာယူပါ။
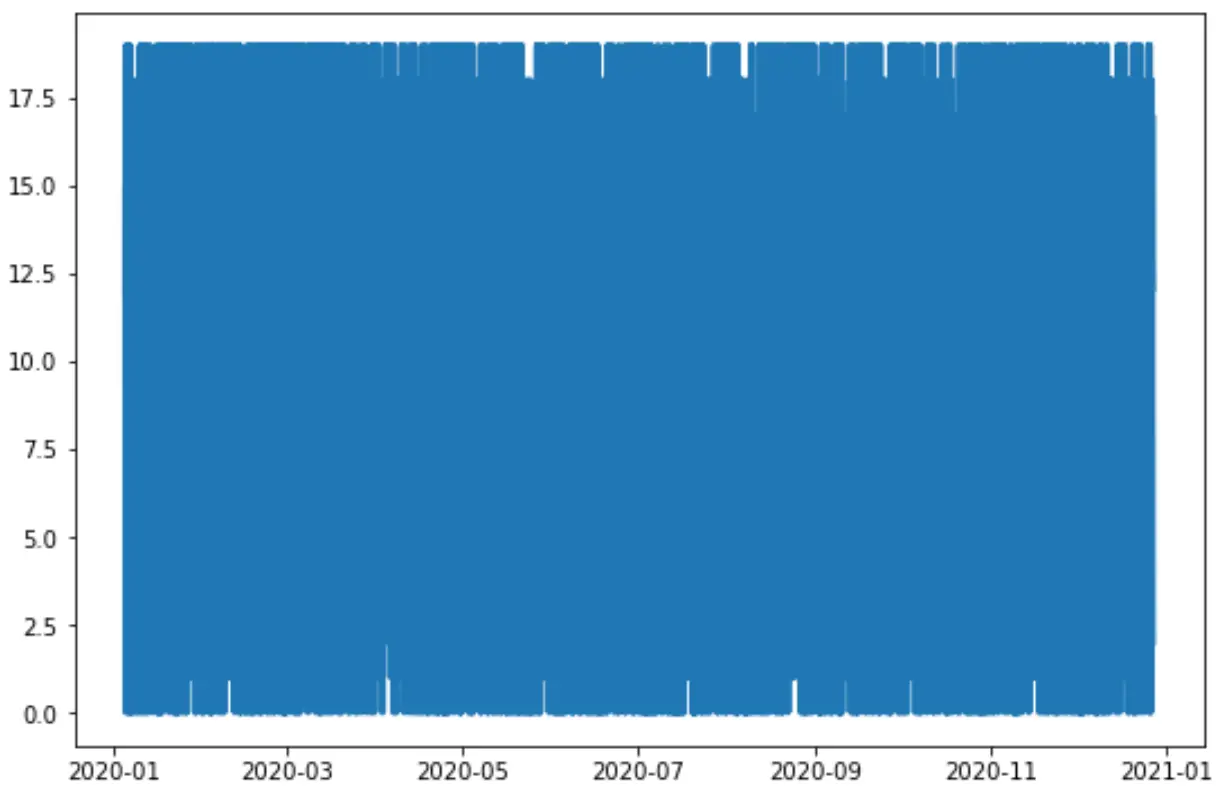
ကုမ္ပဏီတစ်ခုမှ တစ်နှစ်တာကာလအတွင်း တစ်နာရီအတွင်း ကုမ္ပဏီတစ်ခုမှ ရောင်းချသည့် စုစုပေါင်းရောင်းအားကို ပြသသည့် အောက်ပါပန်ဒါ DataFrame ရှိသည်ဆိုပါစို့။
 import pandas as pd
import numpy as np

#make this example reproducible
n.p. random . seeds (0)

#create DataFrame with hourly index
df = pd. DataFrame (index= pd.date_range (' 2020-01-06 ', ' 2020-12-27 ', freq=' h '))

#add column to show sales by hour
df[' sales '] = np. random . randint (low=0, high=20, size= len (df. index ))

#view first five rows of DataFrame
df. head ()

	             dirty
2020-01-06 00:00:00 12
2020-01-06 01:00:00 15
2020-01-06 02:00:00 0
2020-01-06 03:00:00 3
2020-01-06 04:00:00 3
အရောင်းဒေတာကို မြင်သာစေရန် လိုင်းကွက်တစ်ခု ဖန်တီးပါက၊ ၎င်းသည် အောက်ပါအတိုင်း ဖြစ်လိမ့်မည်-
 import matplotlib. pyplot as plt

#plot time series data
plt. plot (df. index , df. sales , linewidth= 3 )
ဤဇယားသည် ဘာသာပြန်ရန်ခက်ခဲသောကြောင့် ကျွန်ုပ်တို့သည် အရောင်းဒေတာကို ရက်သတ္တပတ်အလိုက် အကျဉ်းချုံးနိုင်သည်-
 #create new DataFrame
weekly_df = pd. DataFrame ()

#create 'sales' column that summarizes total sales by week
weekly_df[' sales '] = df[' sales ']. resample (' W '). sum ()

#view first five rows of DataFrame
weekly_df. head ()

                dirty
2020-01-12 1519
2020-01-19 1589
2020-01-26 1540
2020-02-02 1562
2020-02-09 1614
ဤ DataFrame အသစ်သည် တစ်ပတ်လျှင် အရောင်းပမာဏကို ပြသသည်။
ထို့နောက် ကျွန်ုပ်တို့သည် ဤအပတ်စဉ်ဒေတာကို အသုံးပြု၍ အချိန်စီးရီးကြံစည်မှုကို ဖန်တီးနိုင်သည်-
 import matplotlib. pyplot as plt

#plot weekly sales data
plt. plot ( weekly_df.index , weekly_df.sales , linewidth= 3 )
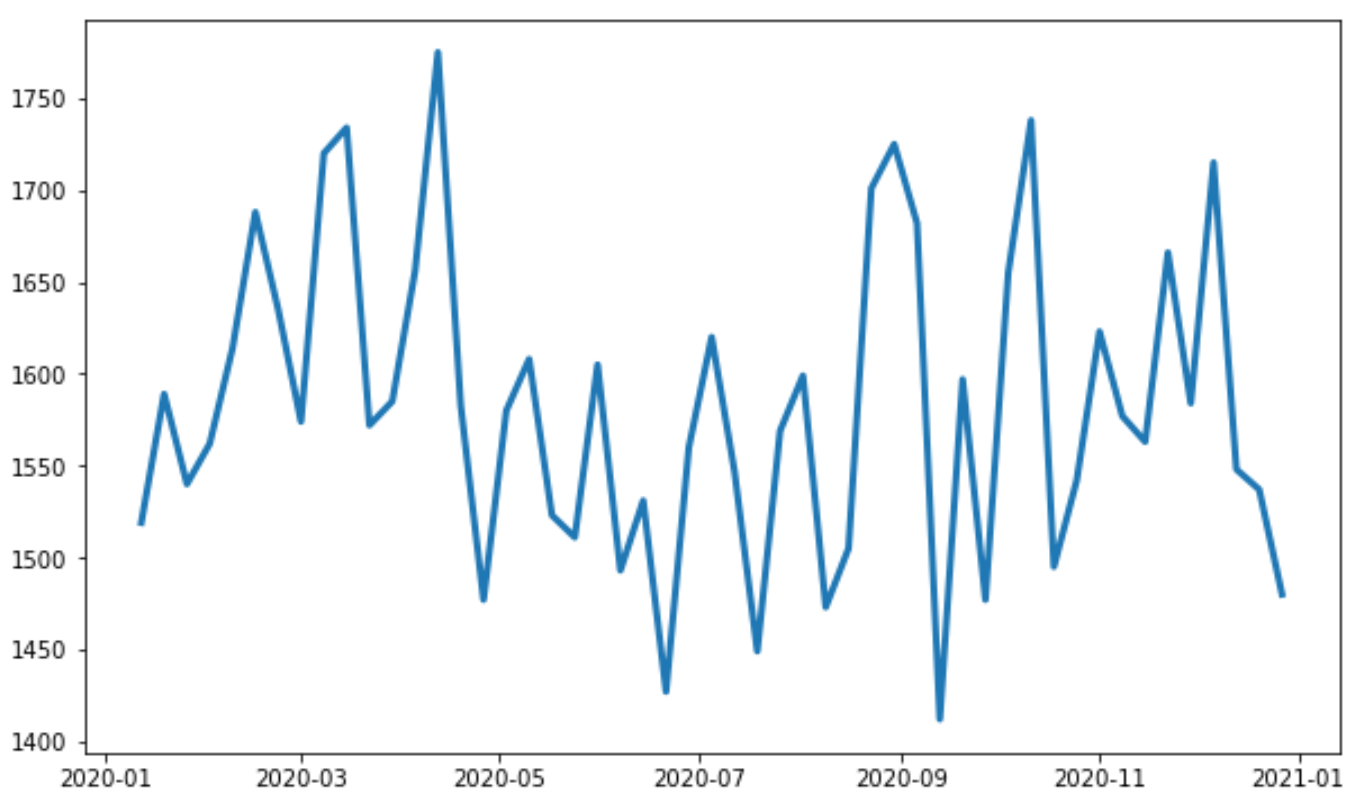
ပထမနမူနာတွင် 8,545 နာရီတစ်လုံးစီအတွက် အရောင်းဒေတာနှင့် ဆန့်ကျင်သည့်အနေဖြင့် ကျွန်ုပ်တို့သည် 51 ရက်သတ္တပတ်တစ်ဦးချင်းစီအတွက် အရောင်းဒေတာကို ကိုယ်စားပြုသောကြောင့် ဤဇယားသည် ဖတ်ရန်ပိုမိုလွယ်ကူပါသည်။
မှတ်ချက် – ဤဥပမာတွင်၊ ကျွန်ုပ်တို့သည် အရောင်းဒေတာကို ရက်သတ္တပတ်အလိုက် အကျဉ်းချုံ့ထားသော်လည်း ဒေတာအချက်များပင် နည်းပါးလိုပါက ကျွန်ုပ်တို့သည် ၎င်းကို လ သို့မဟုတ် သုံးလပတ်အလိုက် အကျဉ်းချုံးနိုင်သည်။
ထပ်လောင်းအရင်းအမြစ်များ
အောက်ပါ သင်ခန်းစာများသည် Python တွင် အခြားသော ဘုံလုပ်ဆောင်ချက်များကို မည်သို့လုပ်ဆောင်ရမည်ကို ရှင်းပြသည်-
Matplotlib တွင် အချိန်စီးရီးတစ်ခုကို ဘယ်လိုဆွဲမလဲ။
Seaborn မှာ အချိန်စီးရီးတစ်ခု ဘယ်လိုဆွဲမလဲ။
Python ရှိ time series မှ MAPE ကို တွက်နည်း
စာရေးသူအကြောင်း
Benjamin Anderson
မင်္ဂလာပါ၊ ကျွန်ုပ်သည် အငြိမ်းစား စာရင်းအင်း ပါမောက္ခ ဘင်ဂျမင်ဖြစ်ပြီး သီးသန့် Statorials ဆရာအဖြစ် လှည့်ပတ်ပါသည်။ စာရင်းဇယားနယ်ပယ်တွင် ကျယ်ပြန့်သောအတွေ့အကြုံနှင့် ကျွမ်းကျင်မှုနှင့်အတူ၊ Statorials မှတစ်ဆင့် ကျောင်းသားများကို ခွန်အားဖြစ်စေရန်အတွက် ကျွန်ုပ်၏အသိပညာကို မျှဝေလိုပါသည်။ ပိုသိတယ်။