R တွင် boxplot axis အညွှန်းများကို မည်သို့ပြောင်းလဲနည်း (ဥပမာများဖြင့်)
R ရှိ boxplot တစ်ခုပေါ်ရှိ X-axis အညွှန်းများကို ပြောင်းလဲရန် အောက်ပါနည်းလမ်းများကို သင်အသုံးပြုနိုင်ပါသည်။
နည်းလမ်း 1- Base R ရှိ Boxplot Axis Labels ကို ပြောင်းပါ။
boxplot(df, names=c(' Label 1 ', ' Label 2 ', ' Label 3 '))
နည်းလမ်း 2- ggplot2 တွင် Boxplot Axis Labels ကိုပြောင်းပါ။
 levels(df_long$variable) <- c(' Label 1 ', ' Label 2 ', ' Label 3 ')

ggplot(df_long, aes(variable, value)) +
  geom_boxplot()
အောက်ဖော်ပြပါ ဥပမာများသည် R ရှိ ဒေတာဘောင်ဖြင့် လက်တွေ့တွင် နည်းလမ်းတစ်ခုစီကို အသုံးပြုနည်းကို ပြသသည်-
 #make this example reproducible
set. seeds (0)

#create data frame
df <- data. frame (A=rnorm(1000, mean=5),
                 B=rnorm(1000, mean=10),
                 C=rnorm(1000, mean=15))

#view head of data frame
head(df)

         ABC
1 6.262954 9.713148 15.44435
2 4.673767 11.841107 15.01193
3 6.329799 9.843236 14.99072
4 6.272429 8.610197 14.69762
5 5.414641 8.526896 15.49236
6 3.460050 9.930481 14.39728
ဥပမာ 1- Base R ရှိ boxplot ဝင်ရိုးအညွှန်းများကို တည်းဖြတ်ပါ။
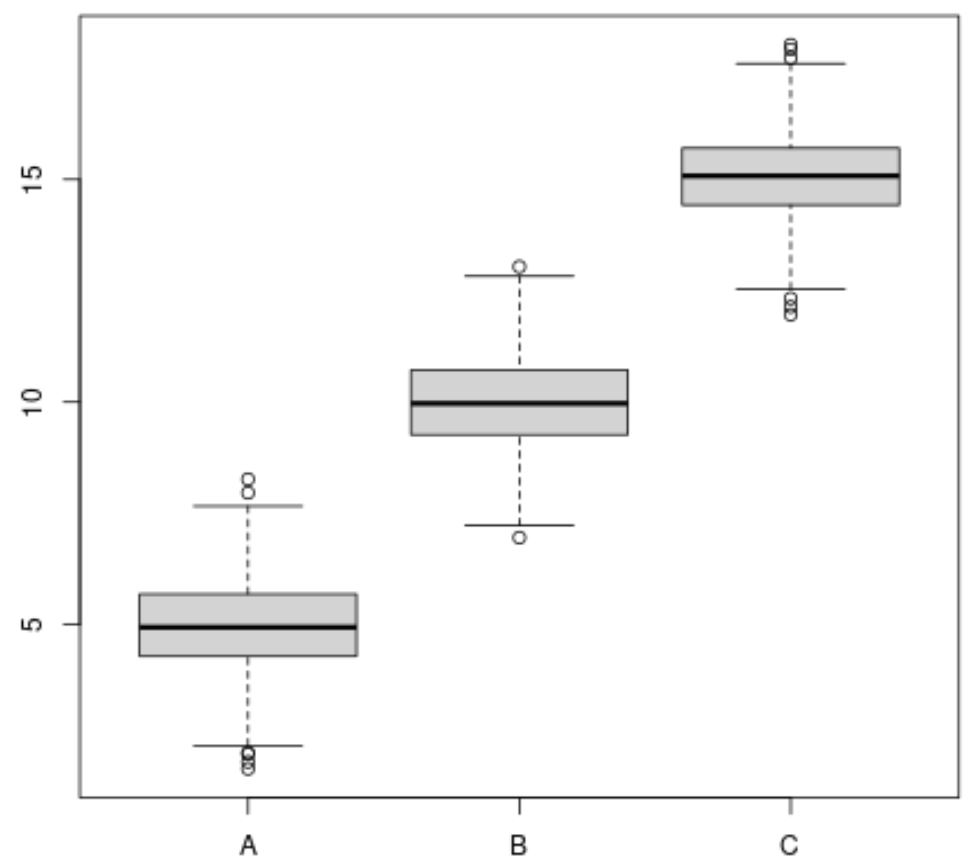
R-based boxplot များဖန်တီးရန် boxplot() လုပ်ဆောင်ချက်ကို အသုံးပြုပါက၊ ဒေတာဘောင်မှ ကော်လံအမည်များကို ပုံသေအားဖြင့် x-axis အညွှန်းများအဖြစ် အသုံးပြုလိမ့်မည်-
 #create boxplots
boxplot(df)
သို့သော်၊ မည်သည့် x-axis အညွှန်းများကို အသုံးပြုရန် သတ်မှတ်ရန် အမည်များ အကြောင်းပြချက်များကို အသုံးပြုနိုင်ပါသည်။
 #create boxplots with specific x-axis names
boxplot(df, names=c(' Team A ', ' Team B ', ' Team C '))
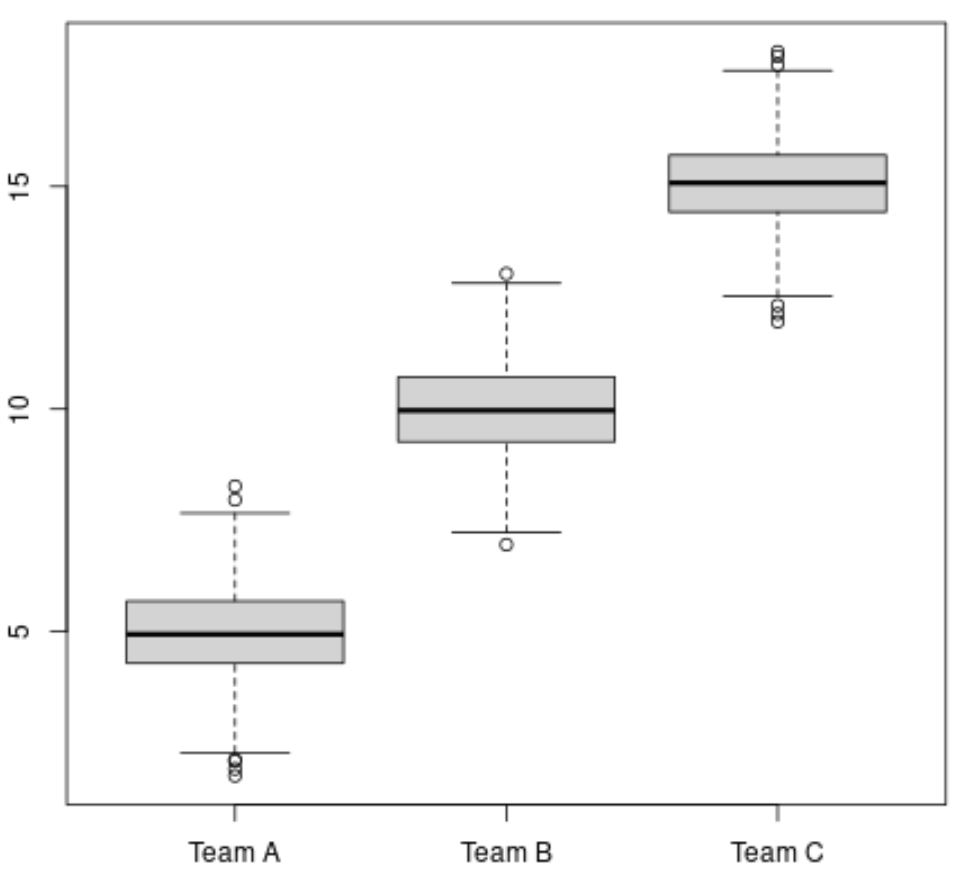
အမည်များ အငြင်းအခုံတွင် ကျွန်ုပ်တို့သတ်မှတ်ထားသော အညွှန်းများကို ယခု x-axis အညွှန်းများအဖြစ် အသုံးပြုကြောင်း သတိပြုပါ။
ဥပမာ 2- ggplot2 တွင် Boxplot ဝင်ရိုးအညွှန်းများကို ပြောင်းပါ။
ggplot2 တွင် boxplot များကိုမဖန်တီးမီ၊ reshape2 ပက်ကေ့ခ်ျမှ melt() လုပ်ဆောင်ချက်ကို ဒေတာဘောင်ကို ရှည်လျားသောဖော်မတ်အဖြစ် “ အရည်ပျော်” ရန် လိုအပ်သည်-
 library (reshape2)

#reshape data frame to long format
df_long <- melt(df)

#view head of long data frame
head(df_long)

  variable value
1 A 6.262954
2 A 4.673767
3 A 6.329799
4 A 6.272429
5 A 5.414641
6 A 3.460050
ထို့နောက် ggplot2 တွင် boxplot ကိုအမှန်တကယ်ဖန်တီးရန်အတွက် x-axis အညွှန်းများနှင့် geom_boxplot() လုပ်ဆောင်ချက်ကို သတ်မှတ်ရန် အဆင့်() လုပ်ဆောင်ချက်ကို အသုံးပြုနိုင်သည်။
 library (ggplot2)

#specify x-axis names to use
levels(df_long$variable) <- c(' Team A ', ' Team B ', ' Team C ')

#create box plot with specific x-axis labels
ggplot(df_long, aes(variable, value)) +
  geom_boxplot()
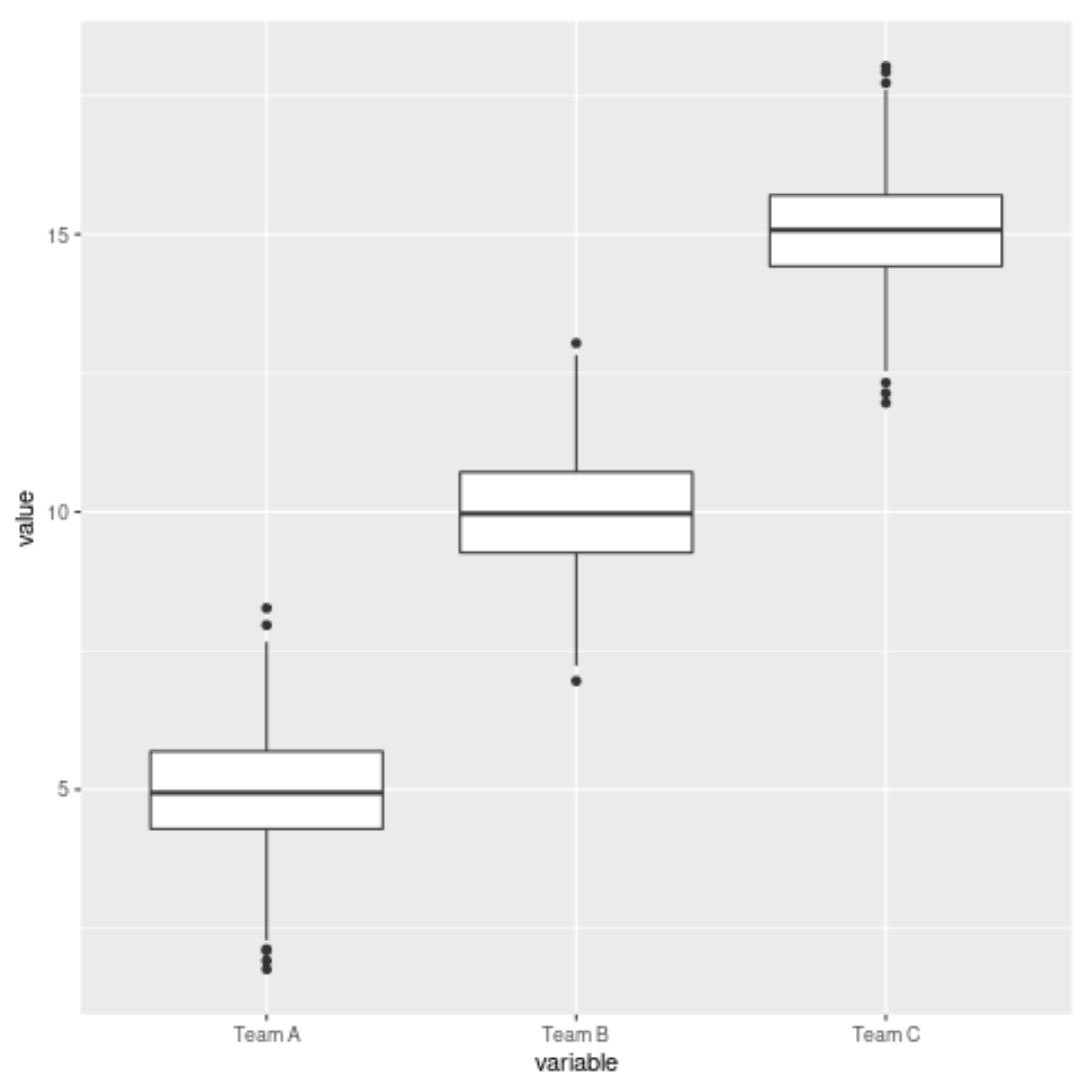
အဆင့်များ လုပ်ဆောင်ချက်ကို အသုံးပြု၍ ကျွန်ုပ်တို့သတ်မှတ်ထားသော အညွှန်းများကို ယခု X ဝင်ရိုးအညွှန်းများအဖြစ် အသုံးပြုကြောင်း သတိပြုပါ။
ထပ်လောင်းအရင်းအမြစ်များ
အောက်ဖော်ပြပါ သင်ခန်းစာများသည် R တွင် အခြားဘုံအလုပ်များကို မည်သို့လုပ်ဆောင်ရမည်ကို ရှင်းပြသည်-
R တွင် boxplot များကိုမည်သို့ပြန်စီရမည်နည်း။
R တွင် အုပ်စုဖွဲ့ထားသော boxplot တစ်ခုကို ဖန်တီးနည်း
R ဖြင့် boxplots များတွင် outliers တံဆိပ်တပ်နည်း
R တွင် အဓိပ္ပါယ်တန်ဖိုးများဖြင့် boxplots များဆွဲနည်း
စာရေးသူအကြောင်း
Benjamin Anderson
မင်္ဂလာပါ၊ ကျွန်ုပ်သည် အငြိမ်းစား စာရင်းအင်း ပါမောက္ခ ဘင်ဂျမင်ဖြစ်ပြီး သီးသန့် Statorials ဆရာအဖြစ် လှည့်ပတ်ပါသည်။ စာရင်းဇယားနယ်ပယ်တွင် ကျယ်ပြန့်သောအတွေ့အကြုံနှင့် ကျွမ်းကျင်မှုနှင့်အတူ၊ Statorials မှတစ်ဆင့် ကျောင်းသားများကို ခွန်အားဖြစ်စေရန်အတွက် ကျွန်ုပ်၏အသိပညာကို မျှဝေလိုပါသည်။ ပိုသိတယ်။