R တွင် တူညီသောဂရပ်များပေါ်တွင် ကွက်ကွက်များစွာကို ဘယ်လိုဆွဲမလဲ (ဥပမာ 3 ခု)
R တွင်တူညီသောဂရပ်ပေါ်တွင်ကွက်ကွက်များစွာဆွဲရန်အောက်ပါနည်းလမ်းများကိုသုံးနိုင်သည်။
နည်းလမ်း 1- တူညီသောဂရပ်ပေါ်တွင် စာကြောင်းများစွာဆွဲပါ။
 #plot first line
plot(x, y1, type=' l ')

#add second line to plot
lines(x, y2)
နည်းလမ်း 2- လမ်းကြောင်းများစွာကို ဘေးချင်းကပ်ဖန်တီးပါ။
 #define plotting area as one row and two columns
by(mfrow = c(1, 2))

#create first plot
plot(x, y1, type=' l ')

#create second plot
plot(x, y2, type=' l ')
နည်းလမ်း 3- ဒေါင်လိုက် အစီအစဥ်များစွာကို ဖန်တီးပါ။
 #define plotting area as two rows and one column
by(mfrow = c(2, 1))

#create first plot
plot(x, y1, type=' l ')

#create second plot
plot(x, y2, type=' l ')
အောက်ဖော်ပြပါ ဥပမာများသည် နည်းလမ်းတစ်ခုစီကို လက်တွေ့အသုံးချနည်းကို ပြသထားသည်။
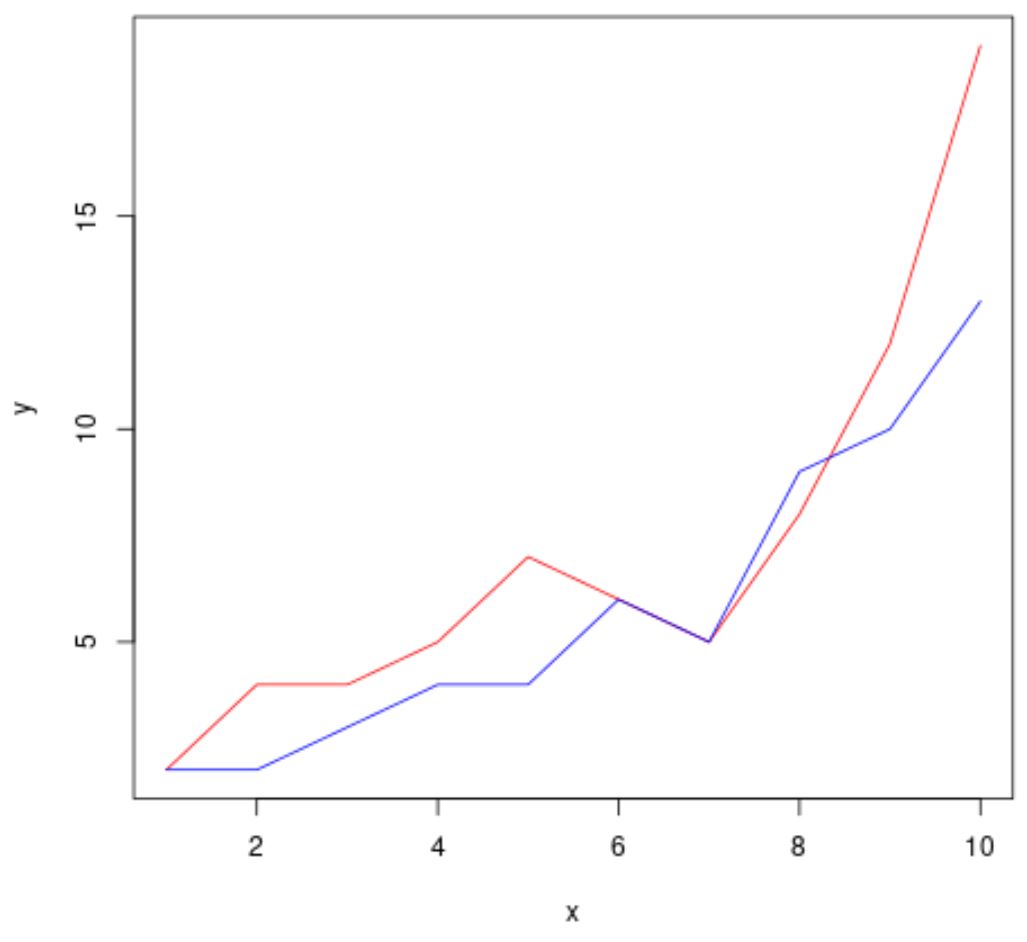
ဥပမာ 1- တူညီသောဂရပ်ပေါ်တွင် စာကြောင်းများစွာဆွဲခြင်း။
အောက်ပါကုဒ်သည် R တွင် တူညီသောဂရပ်ပေါ်တွင် စာကြောင်းနှစ်ကြောင်းဆွဲနည်းကို ပြသသည်-
 #define data to plot
x <- 1:10
y1 <- c(2, 4, 4, 5, 7, 6, 5, 8, 12, 19)
y2 <- c(2, 2, 3, 4, 4, 6, 5, 9, 10, 13)

#plot first line
plot(x, y1, type=' l ', col=' red ', xlab=' x ', ylab=' y ')

#add second line to plot
lines(x, y2, col=' blue ')
ဥပမာ 2- လမ်းကြောင်းများစွာကို ဘေးချင်းကပ်ဖန်တီးပါ။
အောက်ဖော်ပြပါ ကုဒ်သည် par() အငြင်းအခုံကို အသုံးပြုနည်းကို ပြသည်-
 #define data to plot
x <- 1:10
y1 <- c(2, 4, 4, 5, 7, 6, 5, 8, 12, 19)
y2 <- c(2, 2, 3, 4, 4, 6, 5, 9, 10, 13)

#define plotting area as one row and two columns
by(mfrow = c(1, 2))

#create first line plot
plot(x, y1, type=' l ', col=' red ')

#create second line plot
plot(x, y2, type=' l ', col=' blue ', ylim=c(min(y1), max(y1)))
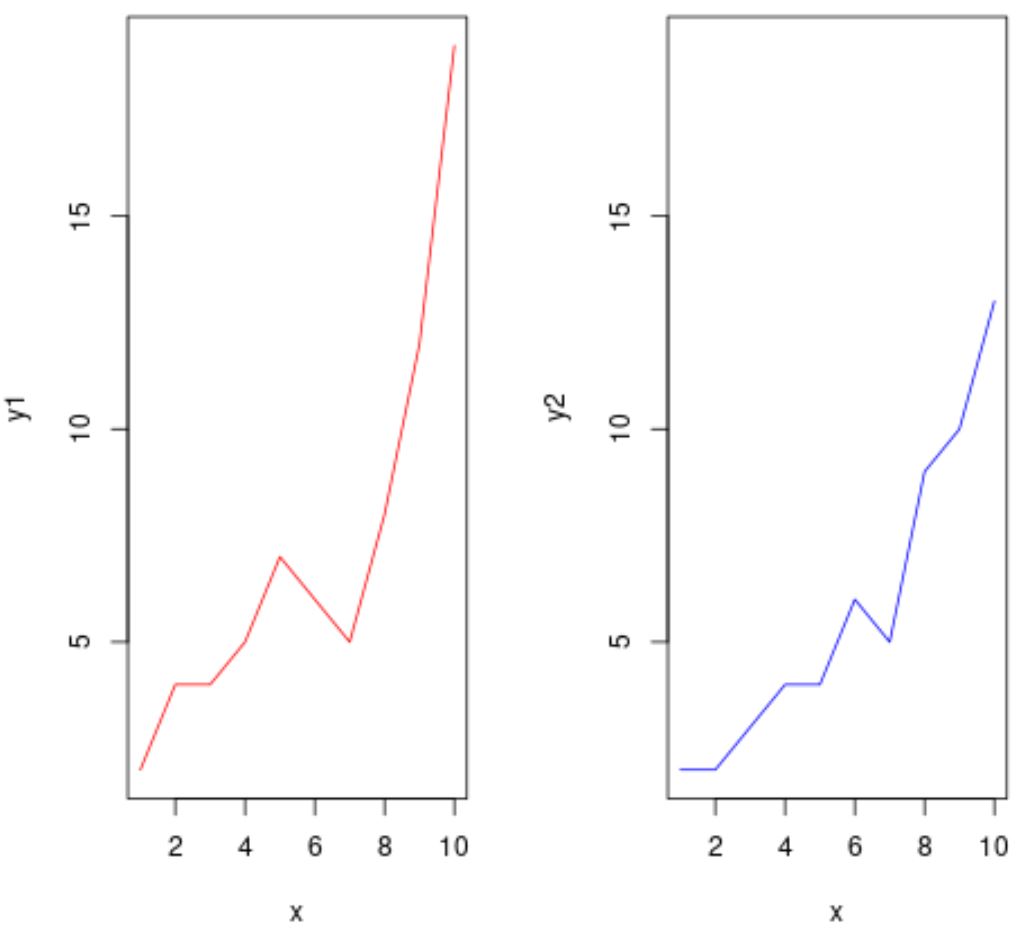
ကွက်နှစ်ခုစလုံးသည် y ဝင်ရိုးပေါ်တွင် တူညီသောကန့်သတ်ချက်များရှိကြောင်း သေချာစေရန်အတွက် ဒုတိယကွက်တွင် ylim() အငြင်းအခုံကို အသုံးပြုခဲ့ကြောင်း သတိပြုပါ။
ဥပမာ 3- ဒေါင်လိုက် အစီအစဥ်များစွာကို ဖန်တီးပါ။
အောက်ဖော်ပြပါ ကုဒ်သည် ဒေါင်လိုက် အစီအစဥ်များစွာကို ချရန် par() အငြင်းအခုံကို အသုံးပြုနည်းကို ပြသသည်-
 #define data to plot
x <- 1:10
y1 <- c(2, 4, 4, 5, 7, 6, 5, 8, 12, 19)
y2 <- c(2, 2, 3, 4, 4, 6, 5, 9, 10, 13)

#define plotting area as two rows and one column
par(mfrow = c(2, 1), mar = c(2, 4, 4, 2))
#create first line plot
plot(x, y1, type=' l ', col=' red ')

#create second line plot
plot(x, y2, type=' l ', col=' blue ', ylim=c(min(y1), max(y1)))
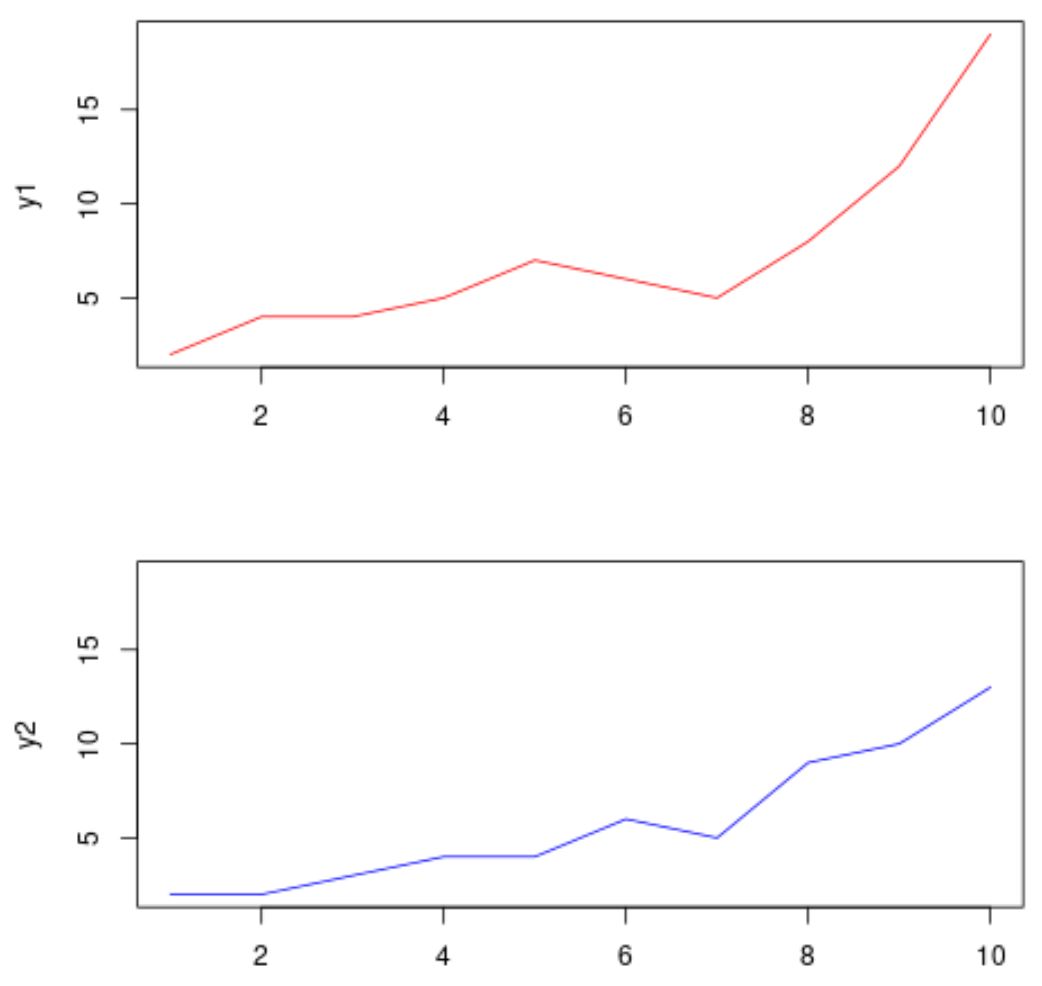
ကွက်ကွက်ဧရိယာ၏အနားသတ်များ (အောက်ခြေ၊ ဘယ်၊ အပေါ်၊ ညာ) ကို သတ်မှတ်ရန် mar argument ကို အသုံးပြုထားကြောင်း သတိပြုပါ။
မှတ်ချက်- မူရင်းမှာ mar = c(5.1၊ 4.1၊ 4.1၊ 2.1)
ထပ်လောင်းအရင်းအမြစ်များ
အောက်ဖော်ပြပါ သင်ခန်းစာများသည် R တွင် အခြားဘုံအလုပ်များကို မည်သို့လုပ်ဆောင်ရမည်ကို ရှင်းပြသည်-
R တွင် ကော်လံများစွာကို ဘယ်လိုဆွဲမလဲ။
R တွင် ဇာတ်ကွက်တစ်ခု၏ အပြင်ဘက်တွင် ဒဏ္ဍာရီကို မည်သို့ဆွဲမည်နည်း။
R တွင် log-log plot ဖန်တီးနည်း
စာရေးသူအကြောင်း
Benjamin Anderson
မင်္ဂလာပါ၊ ကျွန်ုပ်သည် အငြိမ်းစား စာရင်းအင်း ပါမောက္ခ ဘင်ဂျမင်ဖြစ်ပြီး သီးသန့် Statorials ဆရာအဖြစ် လှည့်ပတ်ပါသည်။ စာရင်းဇယားနယ်ပယ်တွင် ကျယ်ပြန့်သောအတွေ့အကြုံနှင့် ကျွမ်းကျင်မှုနှင့်အတူ၊ Statorials မှတစ်ဆင့် ကျောင်းသားများကို ခွန်အားဖြစ်စေရန်အတွက် ကျွန်ုပ်၏အသိပညာကို မျှဝေလိုပါသည်။ ပိုသိတယ်။