R တွင် stacked barplot တစ်ခုကို ဖန်တီးနည်း (ဥပမာများဖြင့်)
stacked barplot သည် မတူညီသော variable များ၏ အရေအတွက်ကို ပြသသည့် chart အမျိုးအစားတစ်ခုဖြစ်ပြီး၊
ဤသင်ခန်းစာတွင် ggplot2 data visualization library ကို အသုံးပြု၍ R တွင် stacked barplot များဖန်တီးနည်းကို ရှင်းပြထားသည်။
Barplot ကို ggplot2 တွင် တွဲထားသည်။
ဘတ်စကက်ဘောကစားသမား ကိုးဦးအတွက် ဂိမ်းတစ်ခုလျှင် ပျမ်းမျှရမှတ်များကို ဖော်ပြသည့် အောက်ပါဒေတာဘောင်တစ်ခုရှိသည်ဆိုပါစို့။
 #create data frame
df <- data.frame(team= rep (c(' A ', ' B ', ' C '), each =3),
                 position= rep (c(' Guard ', ' Forward ', ' Center '), times =3),
                 dots=c(14, 8, 8, 16, 3, 7, 17, 22, 26))

#view data frame
df

  team position points
1 A Guard 14
2 A Forward 8
3 A Center 8
4 B Guard 16
5 B Forward 3
6 B Center 7
7 C Guard 17
8 C Forward 22
9C Center 26
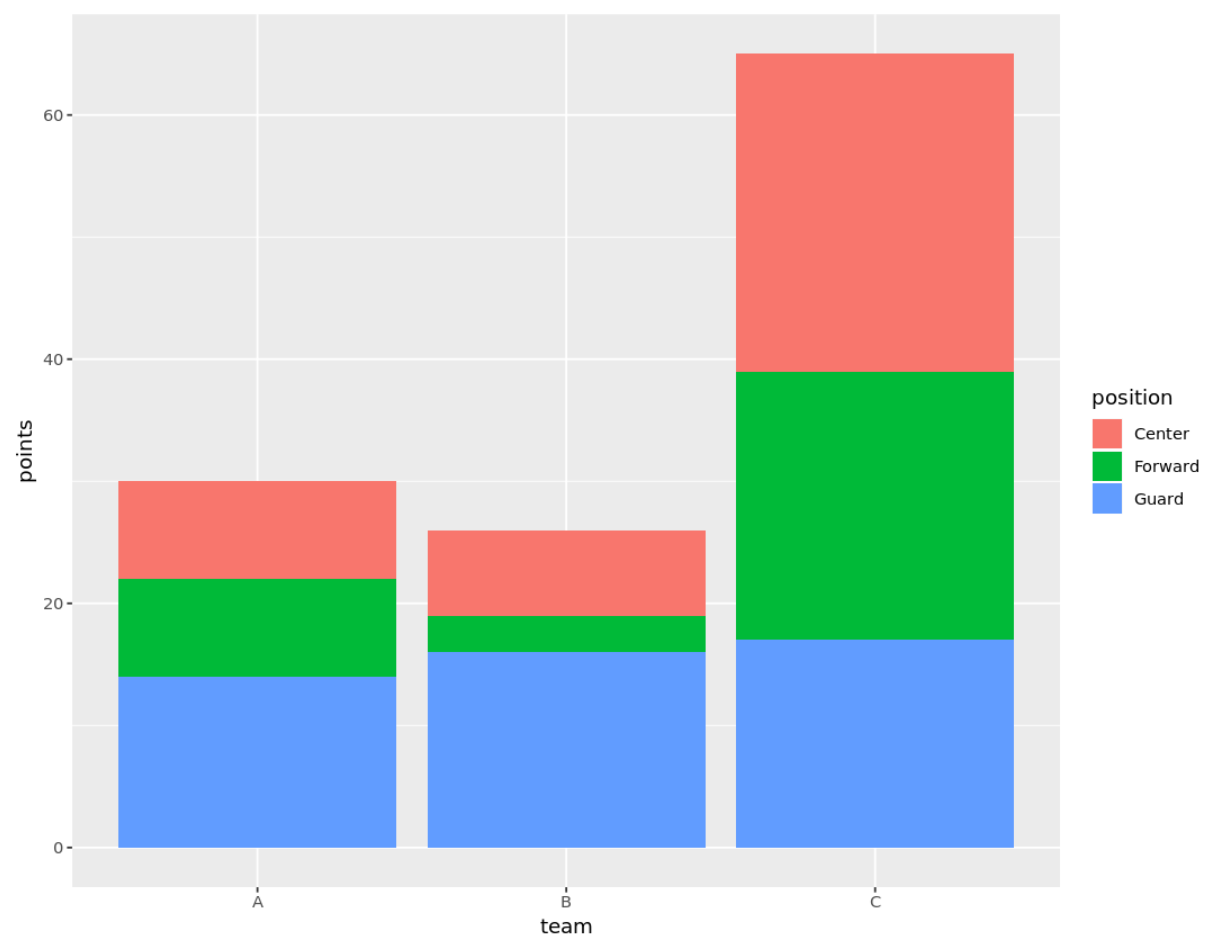
အသင်းနှင့် ရာထူးအလိုက် ကစားသမားတစ်ဦးစီမှ ရမှတ်များကို ပြသသည့် stacked barplot တစ်ခုကို ဖန်တီးရန် အောက်ပါကုဒ်ကို အသုံးပြုနိုင်ပါသည်။
 library (ggplot2)

ggplot(df, aes (fill=position, y=points, x=team)) +
  geom_bar(position=' stack ', stat=' identity ')
Stacked Barplot ကို စိတ်ကြိုက်ပြင်ဆင်ခြင်း။
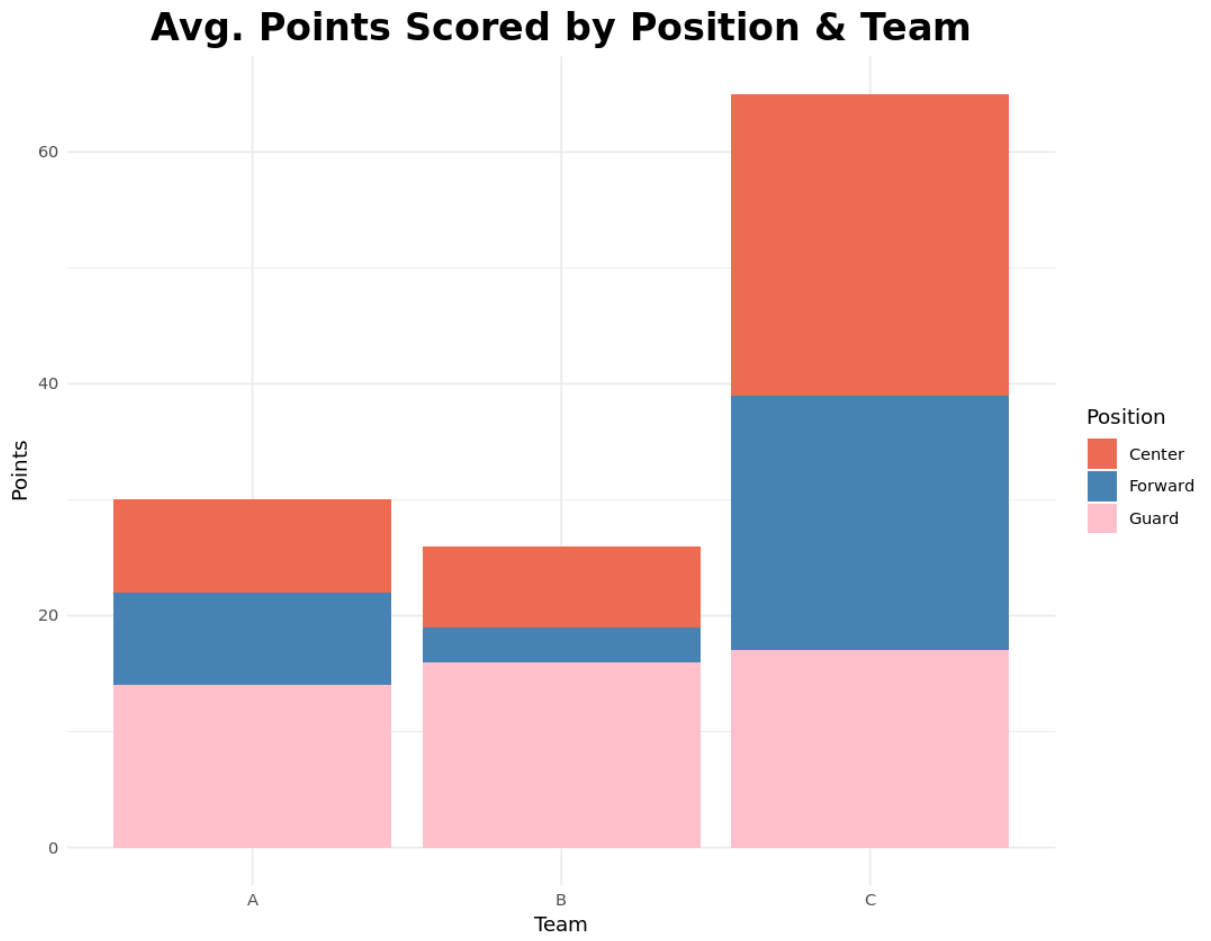
ကျွန်ုပ်တို့လိုချင်သောအသွင်အပြင်ကိုပေးရန်အတွက် ခေါင်းစဉ်၊ ဝင်ရိုးအညွှန်းများ၊ အပြင်အဆင်နှင့် အရောင်များကို စိတ်ကြိုက်ပြင်ဆင်နိုင်သည်-
 library (ggplot2)

ggplot(df, aes (fill=position, y=points, x=team)) +
  geom_bar(position=' stack ', stat=' identity ') +
  theme_minimal() +
  labs(x=' Team ', y=' Points ', title=' Avg. Points Scored by Position & Team ') +
  theme(plot.title = element_text (hjust=0.5, size=20, face=' bold ')) +
  scale_fill_manual(' Position ', values=c(' coral2 ', ' steelblue ', ' pink '))
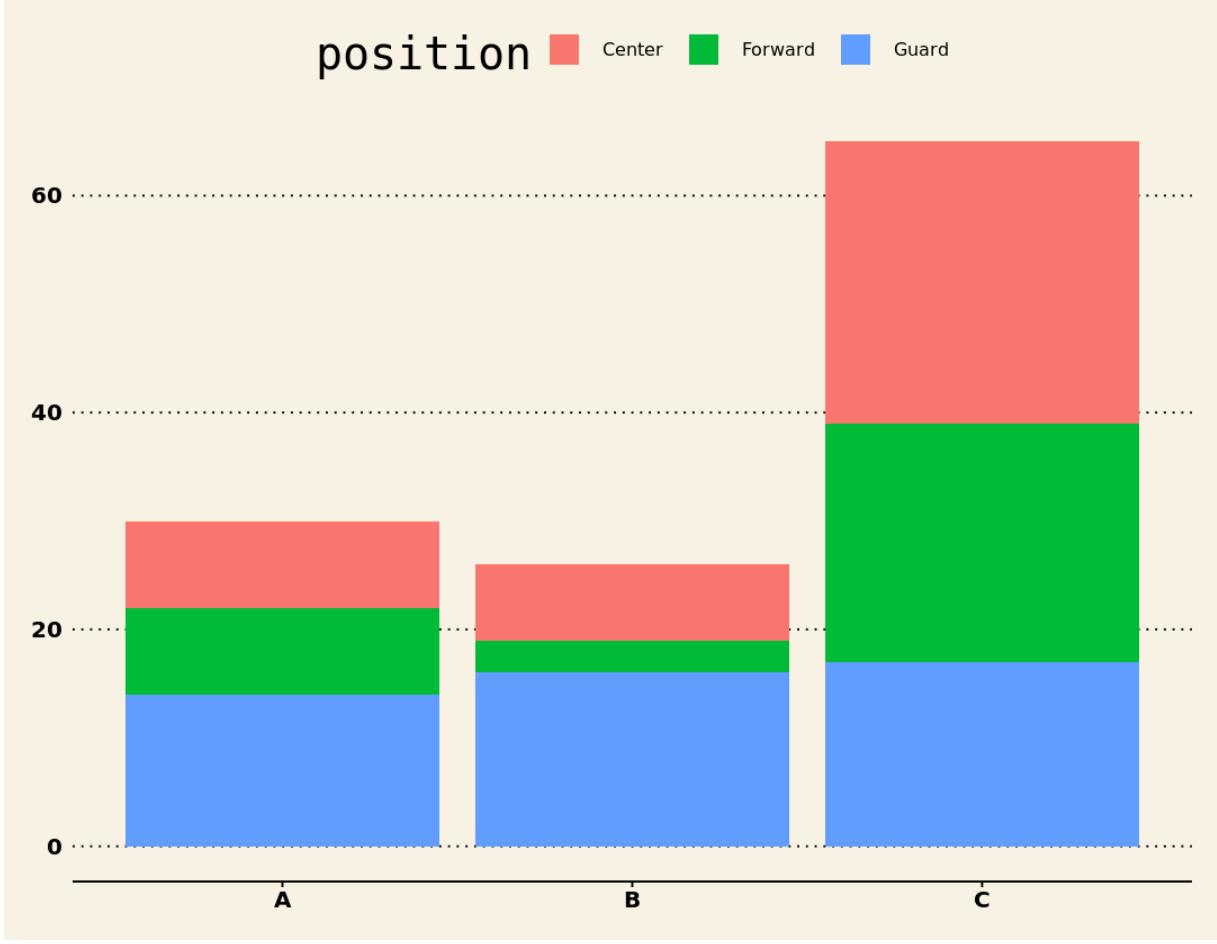
ggthemes ဒစ် ဂျစ်တိုက်ရှိ ကြိုတင်သတ်မှတ်ထားသည့် အပြင်အဆင်များထဲမှ တစ်ခုကို အသုံးပြုခြင်းဖြင့် အသွင်အပြင်ကို စိတ်ကြိုက်ပြင်ဆင်နိုင်သည်။ ဥပမာအားဖြင့်၊ ကျွန်ုပ်တို့သည် ဤစာကြည့်တိုက်မှ Wall Street Journal အပြင်အဆင်ကို အသုံးပြုနိုင်သည်။
 install.packages ('ggthemes')

library (ggplot2)
library (ggthemes)

ggplot(df, aes (fill=position, y=points, x=team)) +
  geom_bar(position=' stack ', stat=' identity ') +
  theme_wsj()
နောက်ထပ်အပြင်အဆင်များအတွက် အကောင်းဆုံး ggplot2 အပြင်အဆင်များအတွက် ကျွန်ုပ်တို့၏အပြည့်အစုံလမ်းညွှန်ကို ကိုးကားပါ။
ထပ်လောင်းအရင်းအမြစ်များ
ggplot2 ခေါင်းစဉ်များအတွက် လမ်းညွှန်ချက်အပြည့်အစုံ
ggplot2 ကို အသုံးပြု၍ R တွင် အုပ်စုဖွဲ့ထားသော boxplot တစ်ခုကို ဖန်တီးနည်း
ggplot2 တွင် ဘေးချင်းကပ်ကွက်များ ဖန်တီးနည်း
စာရေးသူအကြောင်း
Benjamin Anderson
မင်္ဂလာပါ၊ ကျွန်ုပ်သည် အငြိမ်းစား စာရင်းအင်း ပါမောက္ခ ဘင်ဂျမင်ဖြစ်ပြီး သီးသန့် Statorials ဆရာအဖြစ် လှည့်ပတ်ပါသည်။ စာရင်းဇယားနယ်ပယ်တွင် ကျယ်ပြန့်သောအတွေ့အကြုံနှင့် ကျွမ်းကျင်မှုနှင့်အတူ၊ Statorials မှတစ်ဆင့် ကျောင်းသားများကို ခွန်အားဖြစ်စေရန်အတွက် ကျွန်ုပ်၏အသိပညာကို မျှဝေလိုပါသည်။ ပိုသိတယ်။