R တွင် mean values ဖြင့် boxplots များကို မည်သို့ဆွဲရမည် (ဥပမာများဖြင့်)
R တွင် ပျမ်းမျှတန်ဖိုးဖြင့် အကွက်ကွက်ကွက်တစ်ခုဆွဲရန် အောက်ပါနည်းလမ်းများကို အသုံးပြုနိုင်သည်။
နည်းလမ်း 1- Base R ကိုသုံးပါ။
 #create boxplots
boxplot(df$values~df$group)

#calculate mean value by group
means <- tapply(df$values, df$group, mean)

#add means as circles to each boxplot
points(means, pch= 20 )
နည်းလမ်း 2- ggplot2 ကိုသုံးပါ။
 library (ggplot2)

#create boxplots with mean values shown as circles
ggplot(df, aes(x=group, y=values, fill=group)) +
  geom_boxplot() +
  stat_summary(fun=mean, geom=' point ', shape= 20 )
အောက်ဖော်ပြပါ ဥပမာများသည် R ရှိ ဒေတာဘောင်ဖြင့် လက်တွေ့တွင် နည်းလမ်းတစ်ခုစီကို အသုံးပြုနည်းကို ပြသသည်-
 #create data frame
df <- data. frame (team=rep(c('A', 'B', 'C'), each= 5 ),
                 points=c(4, 4, 5, 6, 8, 7, 6, 8, 9, 12,
                          11, 12, 13, 16, 18))

#view first six rows of data frame
head(df)

  team points
1 to 4
2 to 4
3 to 5
4 to 6
5 to 8
6 B 7
ဥပမာ 1- အခြေခံ R တွင် ပျမ်းမျှတန်ဖိုးများဖြင့် boxplots ဖန်တီးပါ။
အောက်ဖော်ပြပါကုဒ်သည် အခြေခံ R တွင် ပျမ်းမျှတန်ဖိုးများဖြင့် boxplots ဖန်တီးနည်းကို ပြသသည်-
 #create boxplots
boxplot(df$points~df$team)

#calculate mean value by group
means <- tapply(df$points, df$team, mean)

#add means as circles to each boxplot
points(means, pch= 20 , cex= 1.5 )
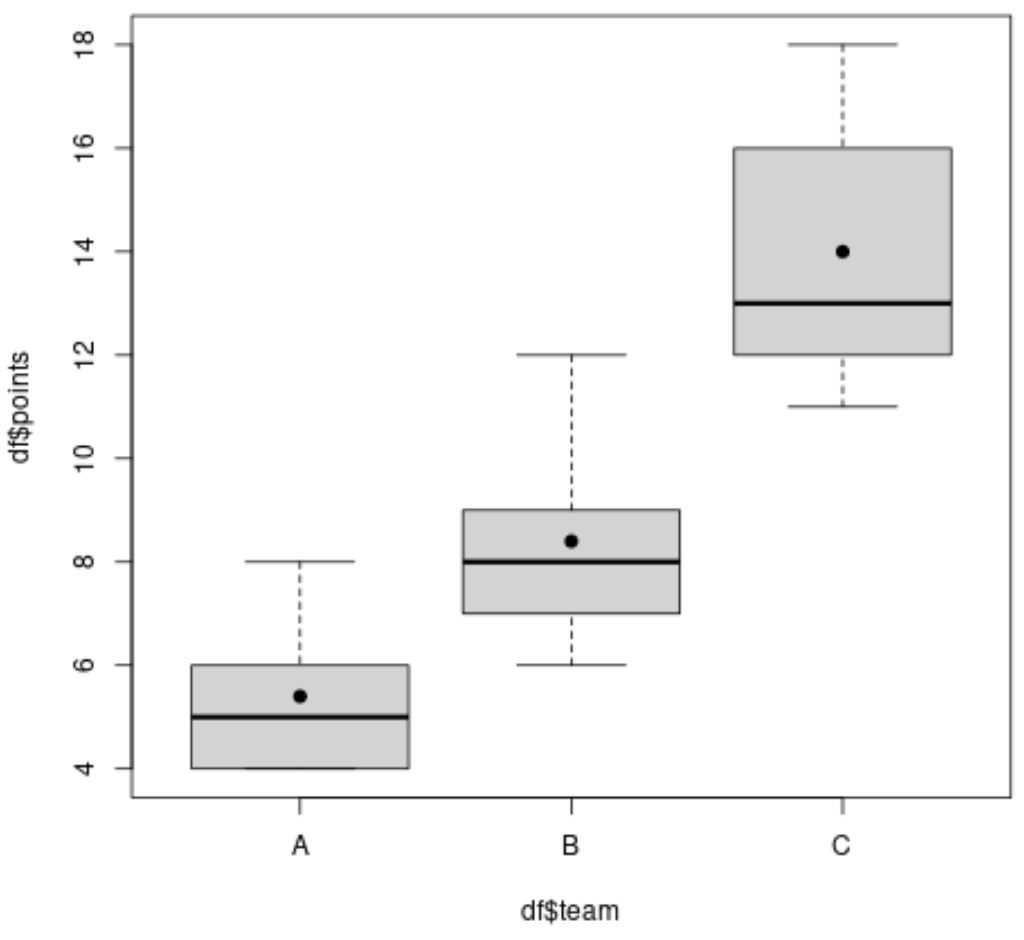
boxplot တစ်ခုစီရှိ အနက်ရောင်မျဉ်းများသည် ပျမ်းမျှ တန်ဖိုးကို ကိုယ်စားပြုပြီး boxplot တစ်ခုစီရှိ အနက်ရောင်စက်ဝိုင်းများသည် ပျမ်းမျှ တန်ဖိုးကို ကိုယ်စားပြုသည်။
မှတ်ချက် – စက်ဝိုင်း၏အရွယ်အစားကိုပြောင်းလဲရန် cex အငြင်းအခုံ၏တန်ဖိုးကိုပြောင်းပါ။
ဥပမာ 2- ggplot2 တွင် ပျမ်းမျှတန်ဖိုးများဖြင့် boxplot များကိုဖန်တီးပါ။
အောက်ပါကုဒ်သည် ggplot2 တွင် ပျမ်းမျှတန်ဖိုးများနှင့်အတူ boxplot များကိုဖန်တီးနည်းကိုပြသသည်-
 library (ggplot2)

#create boxplots with mean values
ggplot(df, aes(x=team, y=points, fill=team)) +
  geom_boxplot() +
  stat_summary(fun=mean, geom=' point ', shape= 20 , size= 8 ) +
  theme(legend. position = ' none ')
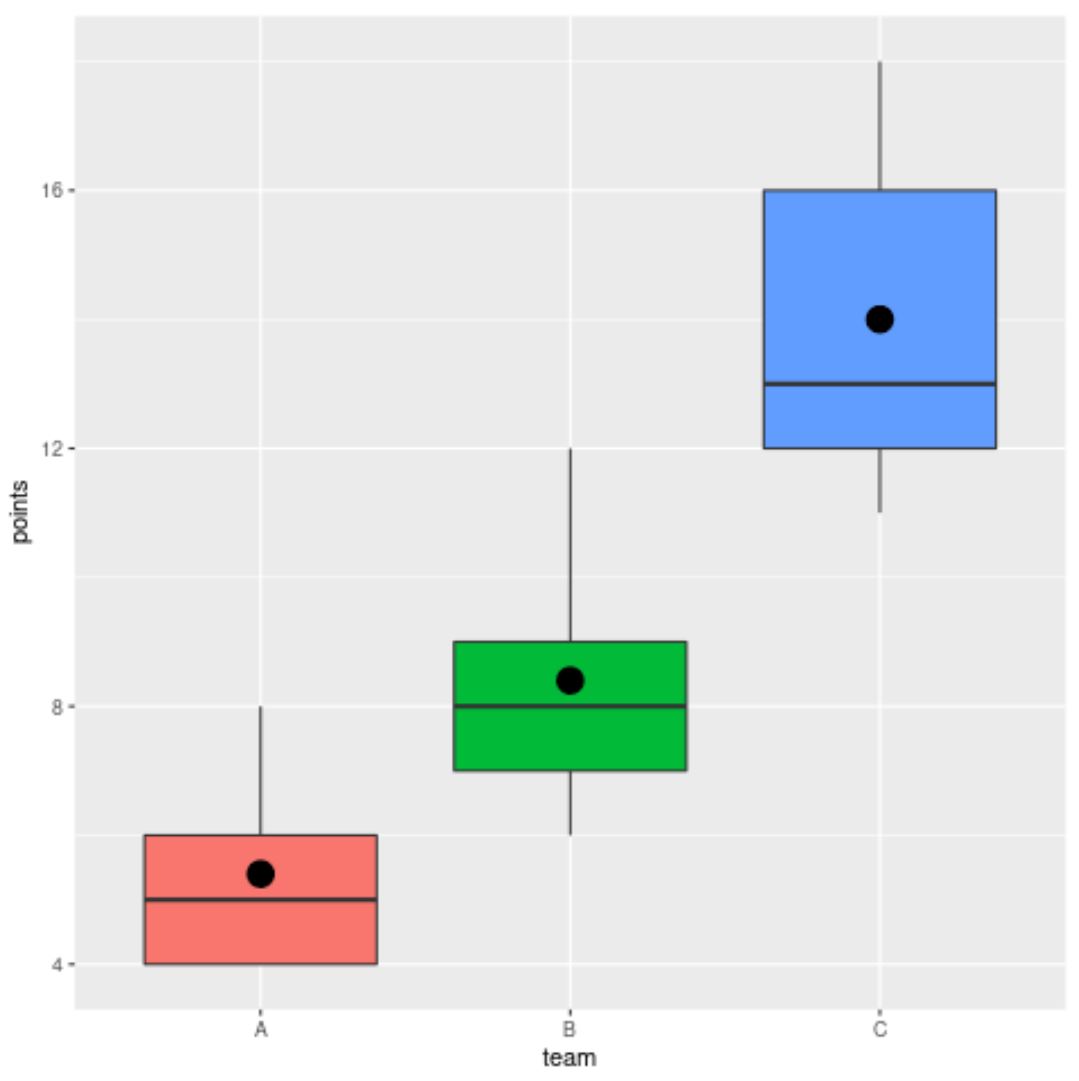
boxplot တစ်ခုစီရှိ အနက်ရောင်မျဉ်းများသည် ပျမ်းမျှ တန်ဖိုးကို ကိုယ်စားပြုပြီး boxplot တစ်ခုစီရှိ အနက်ရောင်စက်ဝိုင်းများသည် ပျမ်းမျှ တန်ဖိုးကို ကိုယ်စားပြုသည်။
မှတ်ချက် – စက်ဝိုင်း၏အရွယ်အစားကိုပြောင်းလဲရန် stat_summary() လုပ်ဆောင်ချက်ရှိ အရွယ်အစား အငြင်းအခုံ၏တန်ဖိုးကို ပြောင်းပါ။
ထပ်လောင်းအရင်းအမြစ်များ
အောက်ဖော်ပြပါ သင်ခန်းစာများသည် boxplots များအကြောင်း နောက်ထပ်အချက်အလက်များကို ပေးဆောင်သည်-
ဘယ်အချိန်မှာ box plot ကိုသုံးသင့်သလဲ။ (၃) အခြေအနေ၊
Box Plots မှာ Asymmetry ကို ဘယ်လိုခွဲခြားသိနိုင်မလဲ။
အကွက်ကွက်များကို နှိုင်းယှဉ်နည်း
စာရေးသူအကြောင်း
Benjamin Anderson
မင်္ဂလာပါ၊ ကျွန်ုပ်သည် အငြိမ်းစား စာရင်းအင်း ပါမောက္ခ ဘင်ဂျမင်ဖြစ်ပြီး သီးသန့် Statorials ဆရာအဖြစ် လှည့်ပတ်ပါသည်။ စာရင်းဇယားနယ်ပယ်တွင် ကျယ်ပြန့်သောအတွေ့အကြုံနှင့် ကျွမ်းကျင်မှုနှင့်အတူ၊ Statorials မှတစ်ဆင့် ကျောင်းသားများကို ခွန်အားဖြစ်စေရန်အတွက် ကျွန်ုပ်၏အသိပညာကို မျှဝေလိုပါသည်။ ပိုသိတယ်။