R တွင် plots များတွင် superscripts နှင့် subscripts များထည့်နည်း
R တွင် ကွက်ကွက်များပေါ်တွင် superscripts သို့မဟုတ် subscripts များကိုထည့်ရန် အောက်ပါအခြေခံအထားအသိုကိုသုံးနိုင်သည်။
 #define expression with superscript
x_expression <- expression(x^ 3 ~ variable ~ label)

#define expression with subscript
y_expression <- expression(y[ 3 ] ~ variable ~ label)

#add expressions to axis labels
plot(x, y, xlab = x_expression, ylab = y_expression)
အောက်ပါဥပမာများသည် ဤ syntax ကိုလက်တွေ့တွင်မည်သို့အသုံးပြုရမည်ကိုပြသထားသည်။
ဥပမာ 1- Axis Labels တွင် ထပ်ညွှန်းများထည့်ပါ။
အောက်ပါကုဒ်သည် R ရှိကွက်တစ်ခု၏ ဝင်ရိုးအညွှန်းများသို့ ထပ်ကိန်းများထည့်နည်းကို ပြသသည်-
 #define data
x <- c(1, 2, 3, 4, 5, 6, 7, 8)
y <- c(9, 12, 14, 16, 15, 19, 26, 29)

#define x and y-axis labels with superscripts
x_expression <- expression(x^3 ~ variable ~ label)
y_expression <- expression(y^3 ~ variable ~ label)

#createplot
plot(x, y, xlab = x_expression, ylab = y_expression)
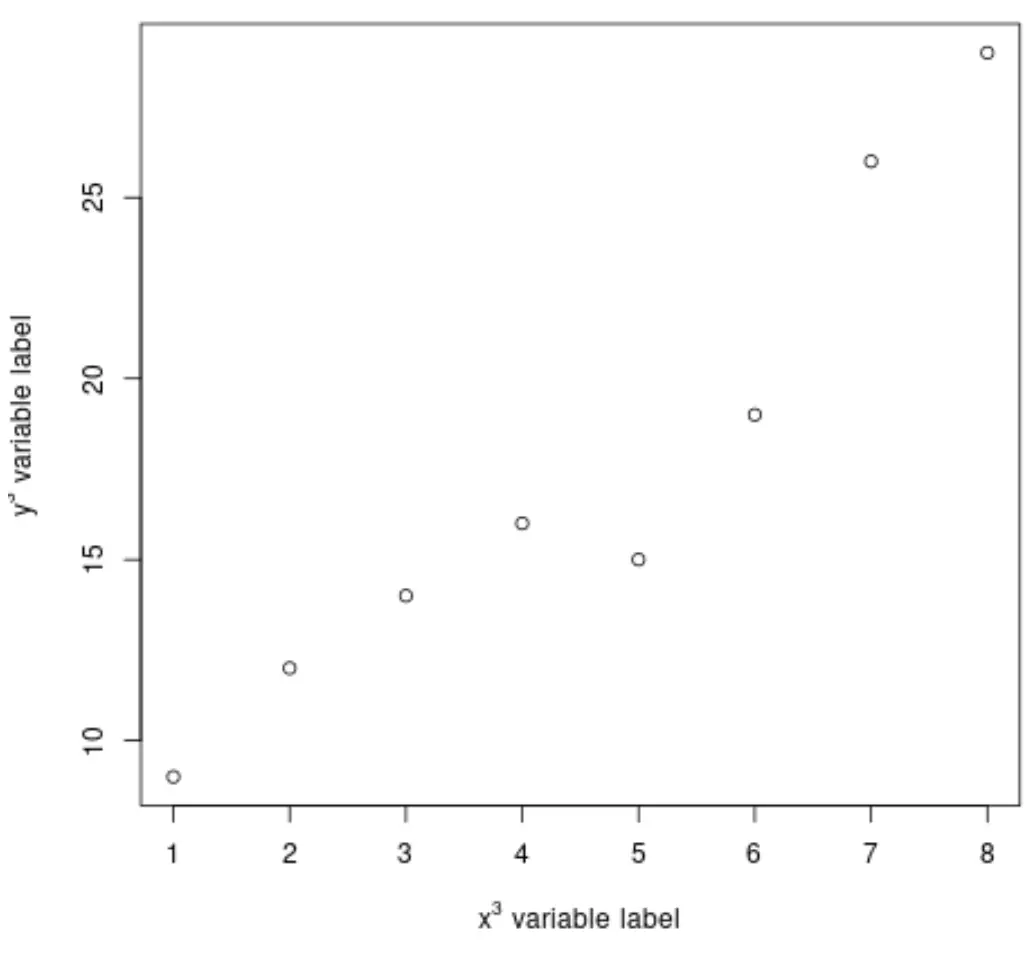
X နှင့် Y axes နှစ်ခုလုံးသည် ၎င်းတို့၏တံဆိပ်တွင် ထပ်ကိန်းတစ်ခုရှိသည်ကို သတိပြုပါ။
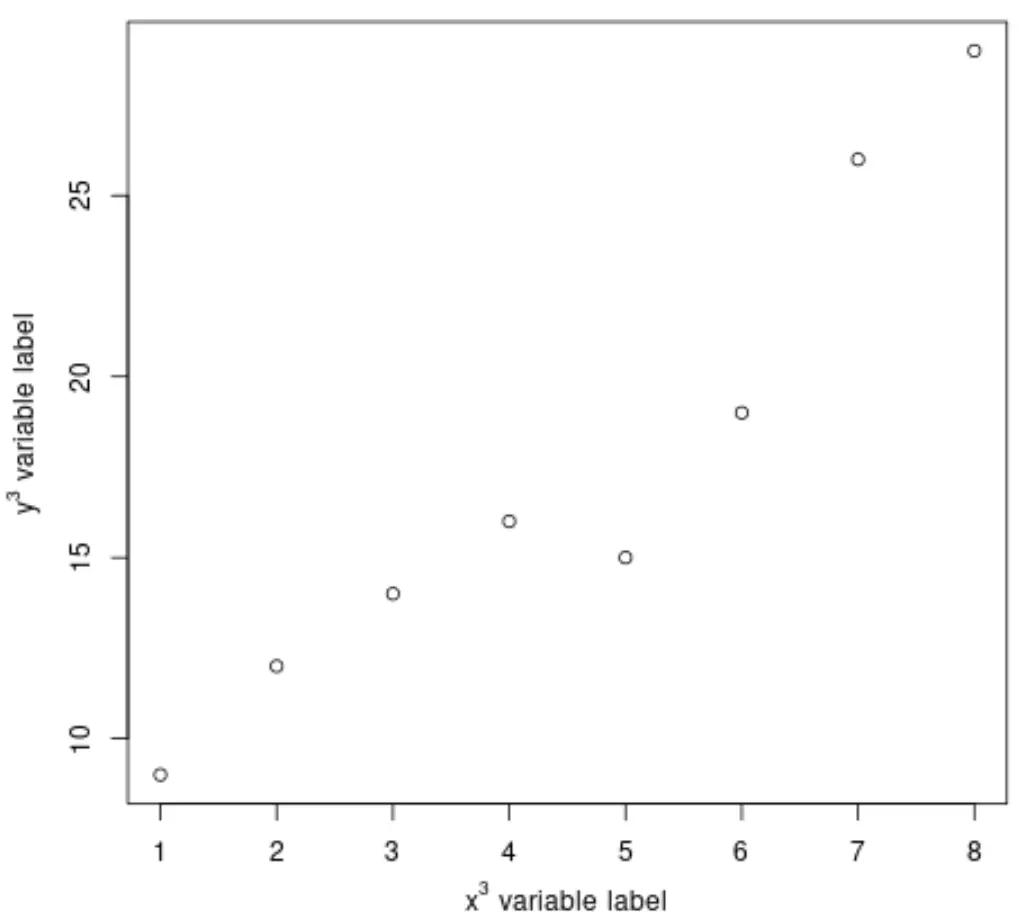
y-axis ထပ်ကိန်းကို ကွက်ကွက်တွင် အနည်းငယ်ဖြတ်ထားသည်။ အညွှန်းများကို ကွက်ကွက်၏ axes နှင့် ပိုမိုနီးကပ်စေရန်၊ R တွင် par() လုပ်ဆောင်ချက်ကို အသုံးပြုနိုင်သည်။
 #adjust by values (default is (3, 0, 0))
by(mgp=c(2.5, 1, 0))

#createplot
plot(x, y, xlab = x_expression, ylab = y_expression)
မှတ်ချက် – ကျွန်ုပ်တို့သည် ထပ်ကိန်းတစ်ခုအဖြစ် သတ်မှတ်ရန် ကျပန်းတန်ဖိုးအဖြစ် “3” ကို ရွေးချယ်ခဲ့သည်။ မည်သည့်ဂဏန်းတန်ဖိုး သို့မဟုတ် စာလုံးကိုမဆို superscript အဖြစ် လွပ်လပ်စွာထားပါ။
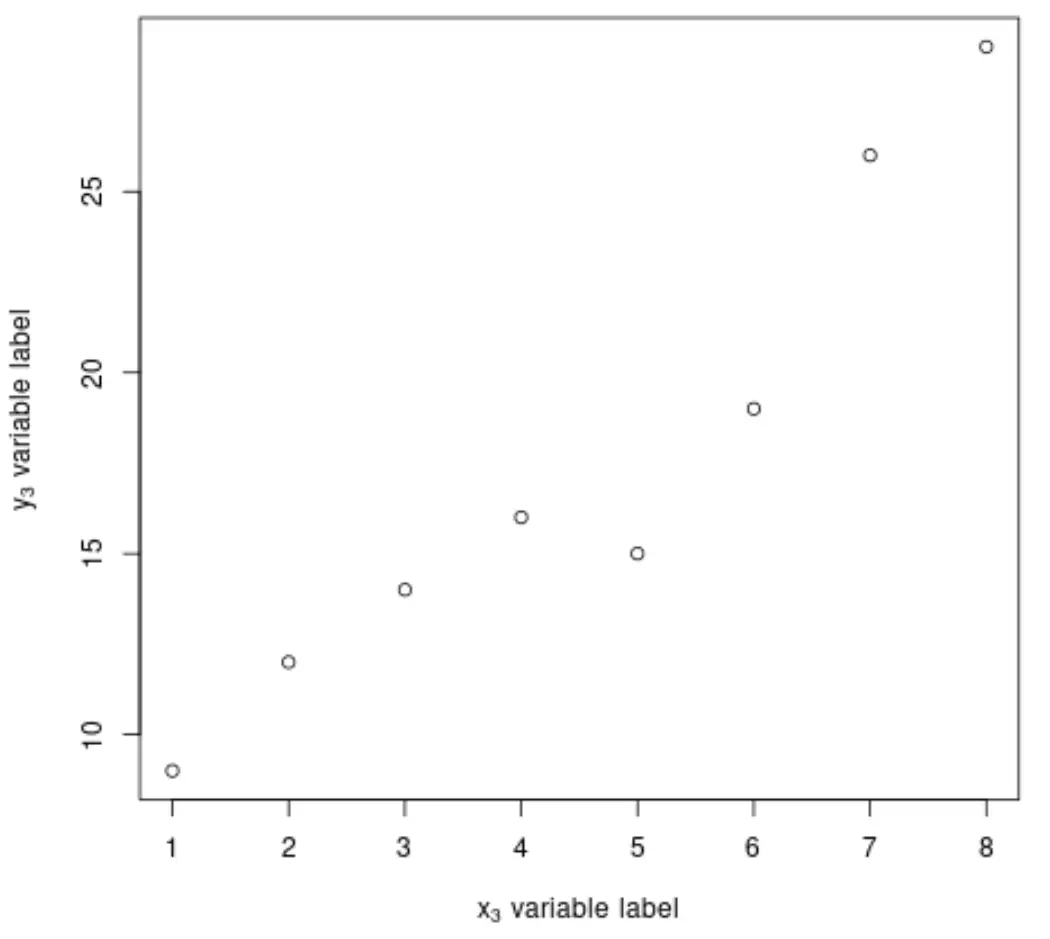
ဥပမာ 2- Axis Labels တွင် Subscript များထည့်ပါ။
အောက်ပါကုဒ်သည် R ရှိကွက်တစ်ခု၏ ဝင်ရိုးအညွှန်းများသို့ အညွှန်းများထည့်နည်းကို ပြသသည်-
 #define data
x <- c(1, 2, 3, 4, 5, 6, 7, 8)
y <- c(9, 12, 14, 16, 15, 19, 26, 29)

#define x and y-axis labels with superscripts
x_expression <- expression(x[3] ~ variable ~ label)
y_expression <- expression(y[3] ~ variable ~ label)

#createplot
plot(x, y, xlab = x_expression, ylab = y_expression)
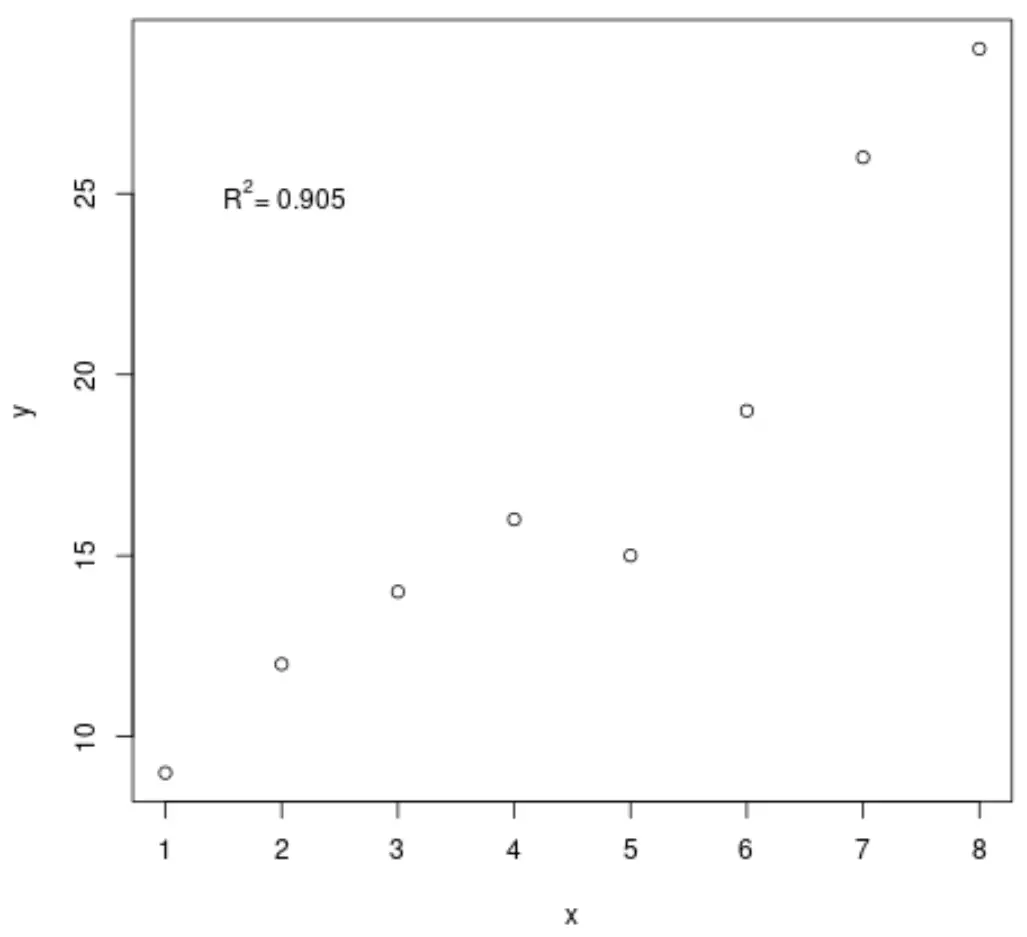
ဥပမာ 3- ဇာတ်ကွက်အတွင်းတွင် Superscripts နှင့် Subscripts များထည့်ခြင်း။
အောက်ပါကုဒ်သည် လမ်းကြောင်းတစ်ခုအတွင်းရှိ စာသားဒြပ်စင်တစ်ခုသို့ စာလုံးကြီးတစ်ခုထည့်နည်းကို ပြသသည်-
 #define data
x <- c(1, 2, 3, 4, 5, 6, 7, 8)
y <- c(9, 12, 14, 16, 15, 19, 26, 29)

#createplot
plot(x, y)

#define label with superscript to add to plot
R2_expression <- expression(paste(" ", R^2 , "= ", .905))

#add text to plot
text(x = 2, y = 25, label = R2_expression)
ထပ်လောင်းအရင်းအမြစ်များ
ကိန်းရှင်များစွာဖြင့် R တွင် scatterplot တစ်ခုကို ဖန်တီးနည်း
R တွင် ဘေးချင်းယှဉ် အကွက်ကွက်များ ဖန်တီးနည်း
R တွင် မြေကွက်များ ထပ်ဆင့်နည်း
စာရေးသူအကြောင်း
Benjamin Anderson
မင်္ဂလာပါ၊ ကျွန်ုပ်သည် အငြိမ်းစား စာရင်းအင်း ပါမောက္ခ ဘင်ဂျမင်ဖြစ်ပြီး သီးသန့် Statorials ဆရာအဖြစ် လှည့်ပတ်ပါသည်။ စာရင်းဇယားနယ်ပယ်တွင် ကျယ်ပြန့်သောအတွေ့အကြုံနှင့် ကျွမ်းကျင်မှုနှင့်အတူ၊ Statorials မှတစ်ဆင့် ကျောင်းသားများကို ခွန်အားဖြစ်စေရန်အတွက် ကျွန်ုပ်၏အသိပညာကို မျှဝေလိုပါသည်။ ပိုသိတယ်။