Python ရှိ regression line ဖြင့် scatter plot ကိုဖန်တီးနည်း
မကြာခဏဆိုသလို၊ ရိုးရှင်းသောမျဉ်းကြောင်းဆုတ်ယုတ်မှုတစ်ခုကိုလုပ်ဆောင်သောအခါ၊ သင်သည် x နှင့် y တန်ဖိုးများ၏ မတူညီသောပေါင်းစပ်မှုများအပြင် ခန့်မှန်းခြေဆုတ်ယုတ်မှုမျဉ်းကိုမြင်ယောင်နိုင်ရန် scatterplot တစ်ခုကိုဖန်တီးလိုပေမည်။
ကံကောင်းစွာဖြင့်၊ Python တွင် ဤဇာတ်ကွက်အမျိုးအစားကို ဖန်တီးရန် လွယ်ကူသော နည်းလမ်းနှစ်ခုရှိသည်။ ဤသင်ခန်းစာတွင် အောက်ပါဒေတာကို အသုံးပြု၍ နည်းလမ်းနှစ်ခုလုံးကို ရှင်းပြထားသည်။
 import numpy as np

#createdata
x = np.array([1, 1, 2, 3, 4, 4, 5, 6, 7, 7, 8, 9])
y = np.array([13, 14, 17, 12, 23, 24, 25, 25, 24, 28, 32, 33])
နည်းလမ်း 1- Matplotlib ကိုသုံးပါ။
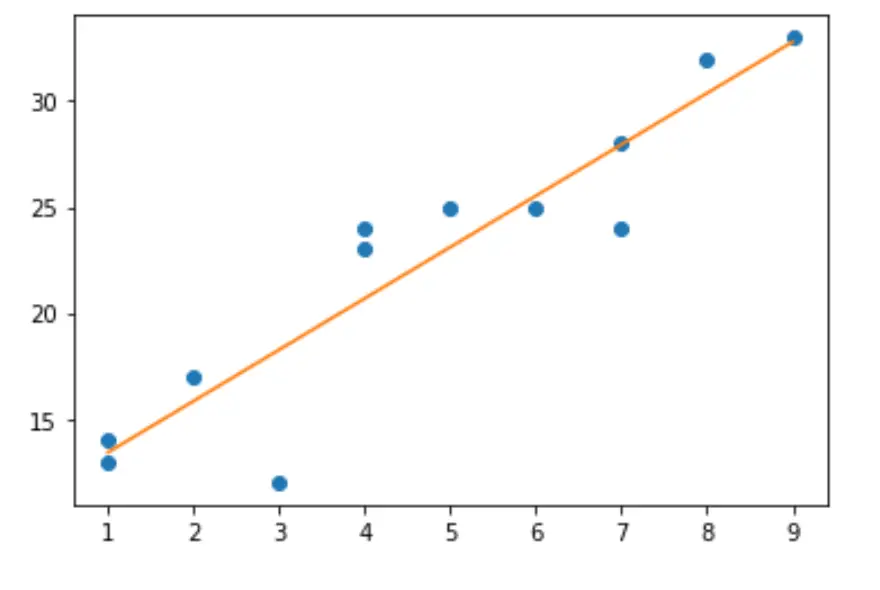
အောက်ပါကုဒ်သည် Matplotlib ကို အသုံးပြု၍ ဤဒေတာအတွက် ခန့်မှန်းခြေ ဆုတ်ယုတ်မှုမျဉ်းဖြင့် ခွဲခြမ်းစိပ်ဖြာမှုတစ်ခုကို ဖန်တီးနည်းကို ပြသသည်-
 import matplotlib.pyplot as plt

#create basic scatterplot
plt.plot(x, y, 'o')

#obtain m (slope) and b(intercept) of linear regression line
m, b = np.polyfit(x, y, 1)

#add linear regression line to scatterplot
plt.plot(x, m*x+b)
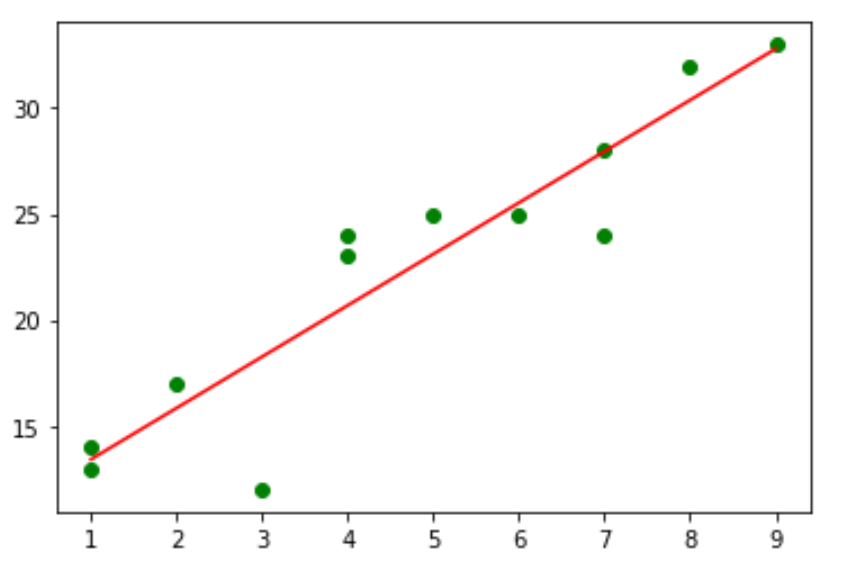
သင်ဆန္ဒရှိအတိုင်းဇယား၏အရောင်များကိုအခမဲ့ခံစားပါ။ ဥပမာအားဖြင့်၊ ဤနေရာတွင် အမှတ်တစ်ခုချင်းစီကို အစိမ်းရောင်အဖြစ်နှင့် မျဉ်းကြောင်းမှ အနီရောင်သို့ ပြောင်းနည်း-
 #use green as color for individual points
plt.plot(x, y, 'o', color=' green ')

#obtain m (slope) and b(intercept) of linear regression line
m, b = np.polyfit(x, y, 1)

#use red as color for regression line
plt.plot(x, m*x+b, color=' red ')
နည်းလမ်း 2: Seaborn ကိုသုံးပါ။
ဆုတ်ယုတ်မှုမျဉ်းဖြင့် ခွဲခြမ်းစိတ်ဖြာမှုတစ်ခုကို ဖန်တီးရန် Seaborn ပုံရိပ်ယောင်စာကြည့်တိုက်၏ regplot() လုပ်ဆောင်ချက်ကိုလည်း သင်အသုံးပြုနိုင်သည်-
 import seaborn as sns

#create scatterplot with regression line
sns.regplot(x, y, ci=None)
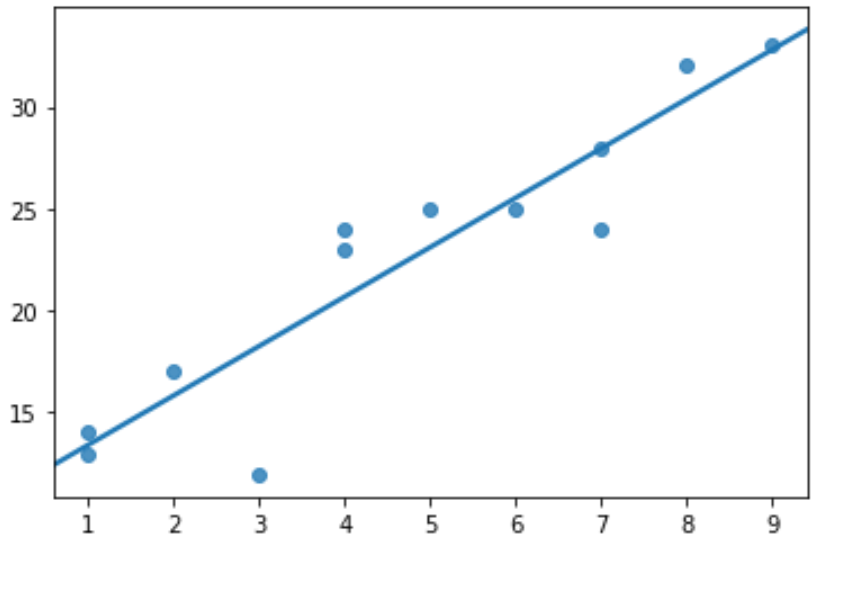
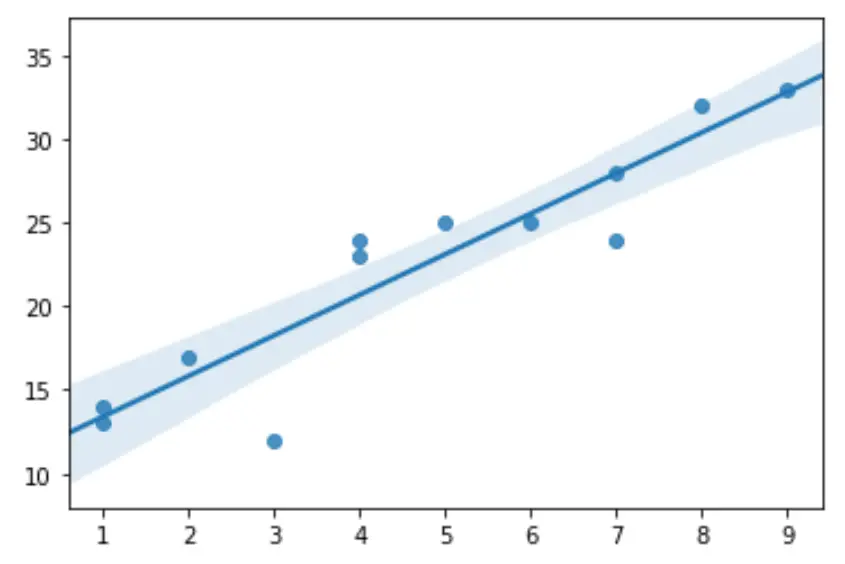
ci=None သည် ဇာတ်ကြောင်းပေါ်ရှိ ယုံကြည်မှုကြားကာလအပိုင်းများကို ဝှက်ထားရန် Seaborn ကို မှတ်သားထားပါ။ သို့သော် သင်ဆန္ဒရှိပါက ၎င်းတို့ကိုပြသရန် သင်ရွေးချယ်နိုင်သည်-
 import seaborn as sns

#create scatterplot with regression line and confidence interval lines
sns.regplot(x,y)
regplot() လုပ်ဆောင်ချက်အတွက် စာရွက်စာတမ်းအပြည့်အစုံကို ဤနေရာတွင် ရှာဖွေနိုင်ပါသည်။
ထပ်လောင်းအရင်းအမြစ်များ
Python တွင် ရိုးရှင်းသော linear regression လုပ်နည်း
Python တွင် Residual Plot ဖန်တီးနည်း
စာရေးသူအကြောင်း
Benjamin Anderson
မင်္ဂလာပါ၊ ကျွန်ုပ်သည် အငြိမ်းစား စာရင်းအင်း ပါမောက္ခ ဘင်ဂျမင်ဖြစ်ပြီး သီးသန့် Statorials ဆရာအဖြစ် လှည့်ပတ်ပါသည်။ စာရင်းဇယားနယ်ပယ်တွင် ကျယ်ပြန့်သောအတွေ့အကြုံနှင့် ကျွမ်းကျင်မှုနှင့်အတူ၊ Statorials မှတစ်ဆင့် ကျောင်းသားများကို ခွန်အားဖြစ်စေရန်အတွက် ကျွန်ုပ်၏အသိပညာကို မျှဝေလိုပါသည်။ ပိုသိတယ်။