Seaborn reglot တွင် ဆုတ်ယုတ်မှုညီမျှခြင်းကို မည်သို့ပြသမည်နည်း။
ဒေတာအစုံနှင့် ကိုက်ညီသော linear regression model ကို ရေးဆွဲရန် seaborn regplot လုပ်ဆောင်ချက်ကို သင်အသုံးပြုနိုင်သည်။
ကံမကောင်းစွာဖြင့်၊ Seaborn တွင် မျဉ်းကြောင်းမှ ဆုတ်ယုတ်မှုညီမျှခြင်းကို ထုတ်ယူရန် built-in အင်္ဂါရပ် မပါရှိသော်လည်း၊ သင်သည် scipy.stats.linregress လုပ်ဆောင်ချက်ကို အသုံးပြု၍ ဆုတ်ယုတ်မှုကိန်းဂဏန်းများကို အမြန်ရှာဖွေနိုင်သည်-
 import scipy
import seaborn as sns

#create regplot
p = sns. regplot (data=df, x=df. x , y=df. y )

#calculate slope and intercept of regression equation
slope, intercept, r, p, sterr = scipy. stats . linregress (x= p.get_lines ()[0] .get_xdata (),
                                                       y=p. get_lines ()[0]. get_ydata ())
အောက်ဖော်ပြပါ ဥပမာသည် ဤ syntax ကို လက်တွေ့တွင် မည်သို့အသုံးပြုရမည်ကို ပြသထားသည်။
ဥပမာ- Seaborn Reglot တွင် ဆုတ်ယုတ်မှုညီမျှခြင်းကို ပြပါ။
ကျွန်ုပ်တို့တွင် အောက်ဖော်ပြပါ ပန်ဒါ DataFrame ရှိသည် ဆိုပါစို့ ကျောင်းသားကျောင်းသူ အသီးသီး၏ သင်ကြားခဲ့သည့် နာရီများနှင့် နောက်ဆုံးစာမေးပွဲရမှတ်များအကြောင်း အချက်အလက်များ ပါ၀င်သည်ဆိုပါစို့။
 import pandas as pd

#createDataFrame
df = pd. DataFrame ({' hours ': [1, 2, 3, 4, 5, 6, 7, 8, 9, 10],
                   ' score ': [77, 79, 84, 80, 81, 89, 95, 90, 83, 89]})

#view DataFrame
print (df)

   hours score
0 1 77
1 2 79
2 3 84
3 4 80
4 5 81
5 6 89
6 7 95
7 8 90
8 9 83
9 10 89
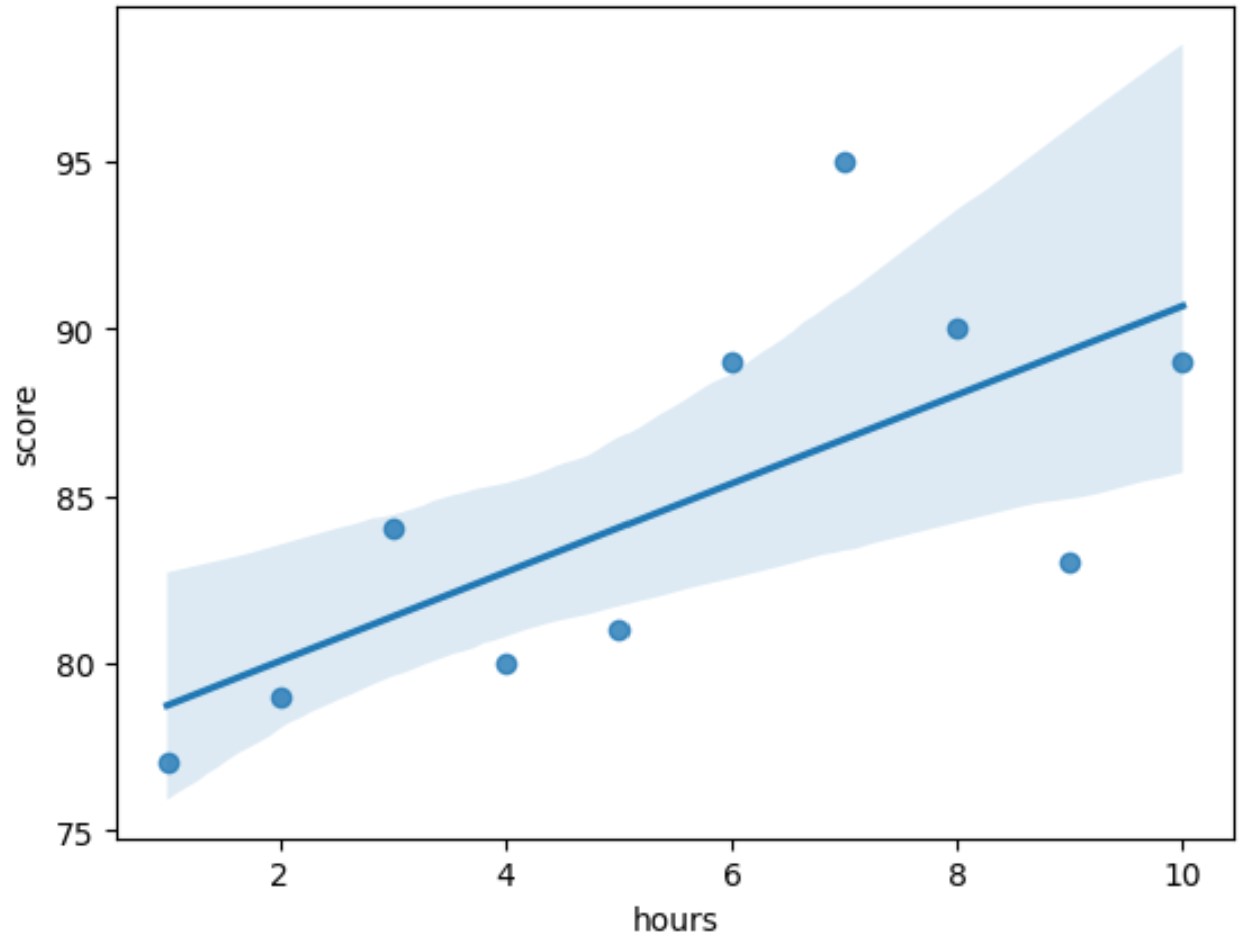
ကျွန်ုပ်တို့သည် ဒေတာအမှတ်များကို ဆွဲချပြီး ဒေတာသို့ တပ်ဆင်ထားသော ဆုတ်ယုတ်မှုမျဉ်းကို ပေါင်းထည့်လိုသည်ဆိုကြပါစို့။
ဒါကိုလုပ်ဖို့ အောက်ပါ syntax ကို သုံးနိုင်ပါတယ်။
 import scipy
import seaborn as sns

#create regplot
p = sns. regplot (data=df, x=df. hours , y=df. score )

#calculate slope and intercept of regression equation
slope, intercept, r, p, sterr = scipy. stats . linregress (x= p.get_lines ()[0] .get_xdata (),
                                                       y=p. get_lines ()[0]. get_ydata ())

#display slope and intercept of regression equation
print (intercept, slope)

77.39999999999995 1.3272727272727356
ရလဒ်မှ၊ ဆုတ်ယုတ်မှုမျဉ်းတွင် အောက်ပါညီမျှခြင်းရှိသည်ကို ကျွန်ုပ်တို့တွေ့မြင်နိုင်သည်-
y = 77.4 + 1.327
seaborn regplot တွင် ဤညီမျှခြင်းအား ပြသလိုပါက matplotlib text() လုပ်ဆောင်ချက်ကို အသုံးပြုနိုင်ပါသည်။
 import matplotlib. pyplot as plt
import scipy
import seaborn as sns

#create regplot
p = sns. regplot (data=df, x=df. hours , y=df. score )

#calculate slope and intercept of regression equation
slope, intercept, r, p, sterr = scipy. stats . linregress (x= p.get_lines ()[0] .get_xdata (),
                                                       y=p. get_lines ()[0]. get_ydata ())

#add regression equation to plot
plt. text (2, 95, ' y = ' + str(round(intercept,3)) + ' + ' + str(round(slope,3)) + ' x ')
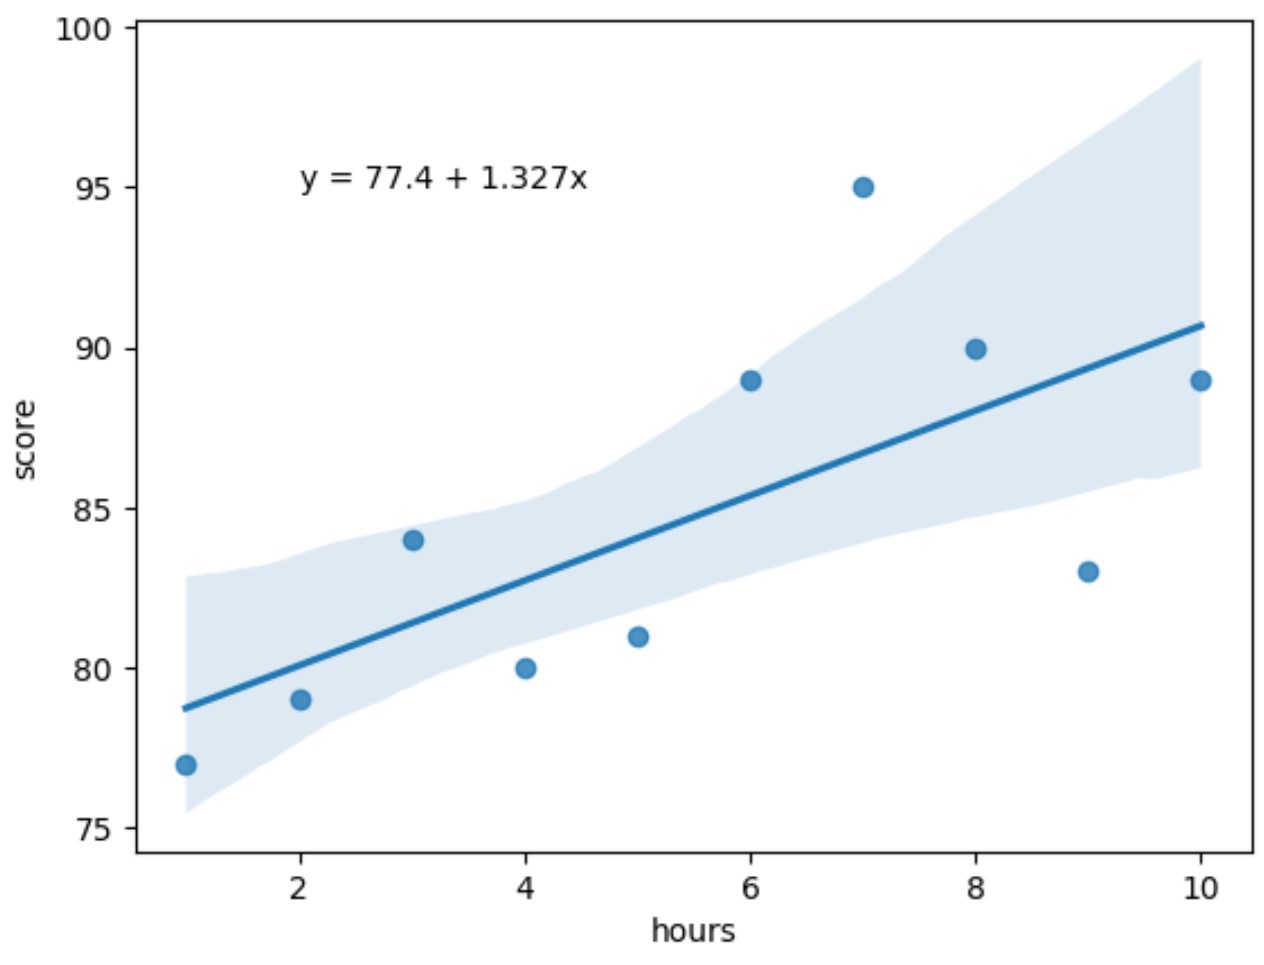
ဆုတ်ယုတ်မှုညီမျှခြင်းအား ကွက်ကွက်၏ ဘယ်ဘက်အပေါ်ထောင့်တွင် ယခုပြသထားကြောင်း သတိပြုပါ။
text() function တွင် regression equation ကို (x, y) coordinates များမှ (2, 95) မှပြသသင့်သည်ဟု ကျွန်ုပ်တို့သတ်မှတ်ထားသည်ကို သတိပြုပါ။
သင့်ကိုယ်ပိုင်ကြံစည်မှုတွင် သင်အလိုရှိသည့်နေရာတိုင်းတွင် ဆုတ်ယုတ်ညီမျှခြင်းကိုပြသရန် ဤသြဒိနိတ်များကို အခမဲ့ပြင်ဆင်ပါ။
မှတ်ချက် – seaborn regplot လုပ်ဆောင်ချက်အတွက် စာရွက်စာတမ်းအပြည့်အစုံကို ဤနေရာတွင် ရှာဖွေနိုင်ပါသည်။
ထပ်လောင်းအရင်းအမြစ်များ
အောက်ဖော်ပြပါ သင်ခန်းစာများသည် Seaborn တွင် အခြားဘုံအလုပ်များကို မည်သို့လုပ်ဆောင်ရမည်ကို ရှင်းပြသည်-
Seaborn ဇာတ်ကွက်၏ ပုံအရွယ်အစားကို ချိန်ညှိနည်း
Seaborn မှာ ဒဏ္ဍာရီတစ်ယောက်ရဲ့ အနေအထားကို ဘယ်လိုပြောင်းမလဲ။
Seaborn ကွက်တွင် ဝင်ရိုးအညွှန်းများကို မည်သို့ပြောင်းရမည်နည်း။
စာရေးသူအကြောင်း
Benjamin Anderson
မင်္ဂလာပါ၊ ကျွန်ုပ်သည် အငြိမ်းစား စာရင်းအင်း ပါမောက္ခ ဘင်ဂျမင်ဖြစ်ပြီး သီးသန့် Statorials ဆရာအဖြစ် လှည့်ပတ်ပါသည်။ စာရင်းဇယားနယ်ပယ်တွင် ကျယ်ပြန့်သောအတွေ့အကြုံနှင့် ကျွမ်းကျင်မှုနှင့်အတူ၊ Statorials မှတစ်ဆင့် ကျောင်းသားများကို ခွန်အားဖြစ်စေရန်အတွက် ကျွန်ုပ်၏အသိပညာကို မျှဝေလိုပါသည်။ ပိုသိတယ်။