Matplotlib အပိုင်းခွဲများကြား အကွာအဝေးကို ချိန်ညှိနည်း
Matplotlib တွင် တစ်ခုနှင့်တစ်ခု ဘေးရှိ ကွက်ကွက်များစွာကို ပြသရန် အပိုင်းခွဲများကို မကြာခဏ အသုံးပြုနိုင်သည်။ ကံမကောင်းစွာပဲ၊ ဤအပိုင်းခွဲများသည် ပုံသေအားဖြင့် ထပ်နေတတ်သည်။
ဤပြဿနာကိုဖြေရှင်းရန် အလွယ်ကူဆုံးနည်းလမ်းမှာ Matplotlib Tight_layout() လုပ်ဆောင်ချက်ကို အသုံးပြုခြင်းဖြစ်သည်။ ဤသင်ခန်းစာတွင် ဤလုပ်ဆောင်ချက်ကို လက်တွေ့အသုံးချနည်းကို ရှင်းပြထားသည်။
အပိုင်းခွဲများဖန်တီးပါ။
ကော်လံ 2 ခုနှင့် အတန်း 2 ခုရှိ အောက်ပါအပိုင်းခွဲ 4 ခု၏ အစီအစဉ်ကို သုံးသပ်ကြည့်ပါ-
 import matplotlib.pyplot as plt

#define subplots
fig, ax = plt. subplots (2, 2)

#display subplots
plt. show ()
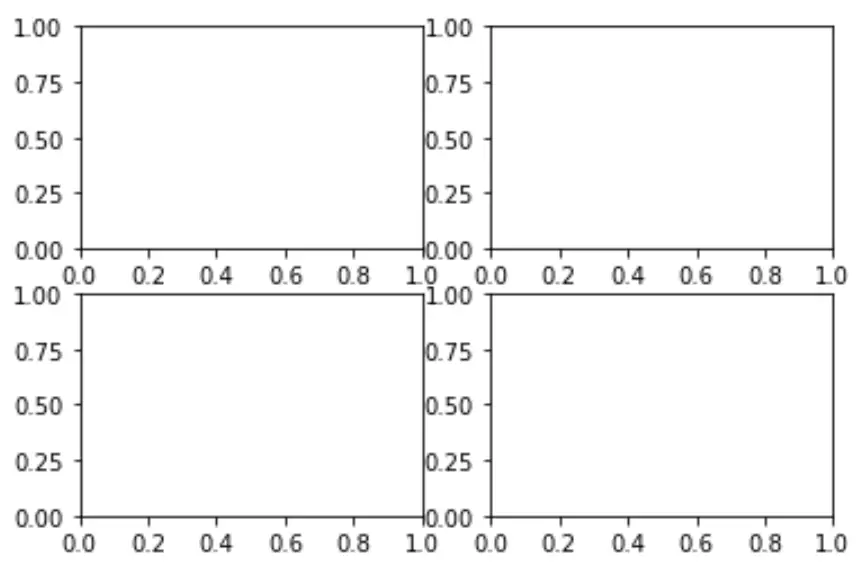
အပိုင်းခွဲများသည် အနည်းငယ်ထပ်နေပုံကို သတိပြုပါ။
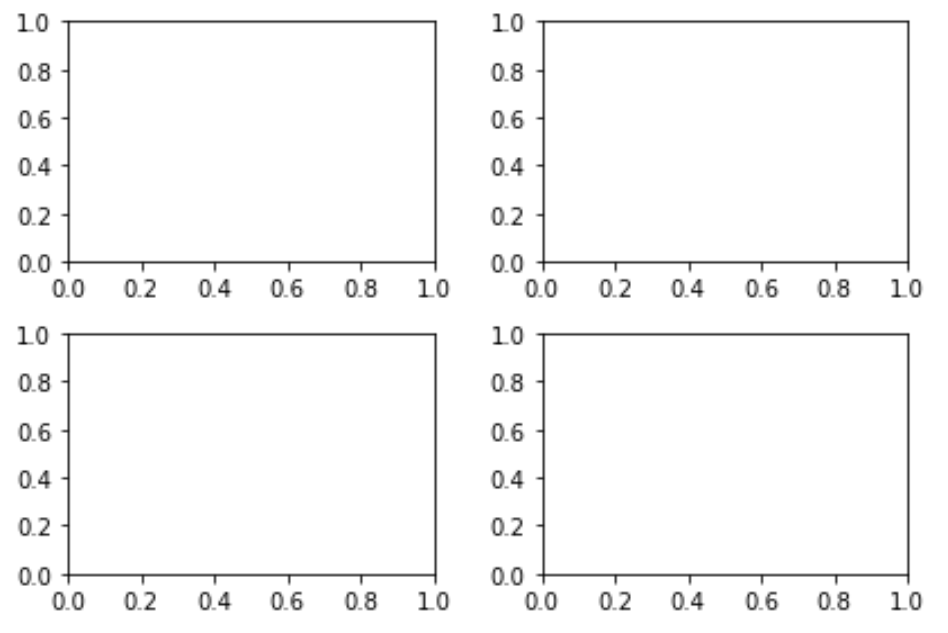
Tight_layout() ကို အသုံးပြု၍ အပိုင်းခွဲအကွာအဝေးကို ချိန်ညှိပါ
ဤထပ်နေသောပြဿနာကိုဖြေရှင်းရန် အလွယ်ကူဆုံးနည်းလမ်းမှာ Matplotlib Tight_layout() လုပ်ဆောင်ချက်ကို အသုံးပြုရန်ဖြစ်သည်။
 import matplotlib.pyplot as plt

#define subplots
fig, ax = plt. subplots (2, 2)
fig. tight_layout ()

#display subplots
plt. show ()
အပိုင်းခွဲခေါင်းစဉ်များ၏ အကွာအဝေးကို ချိန်ညှိပါ။
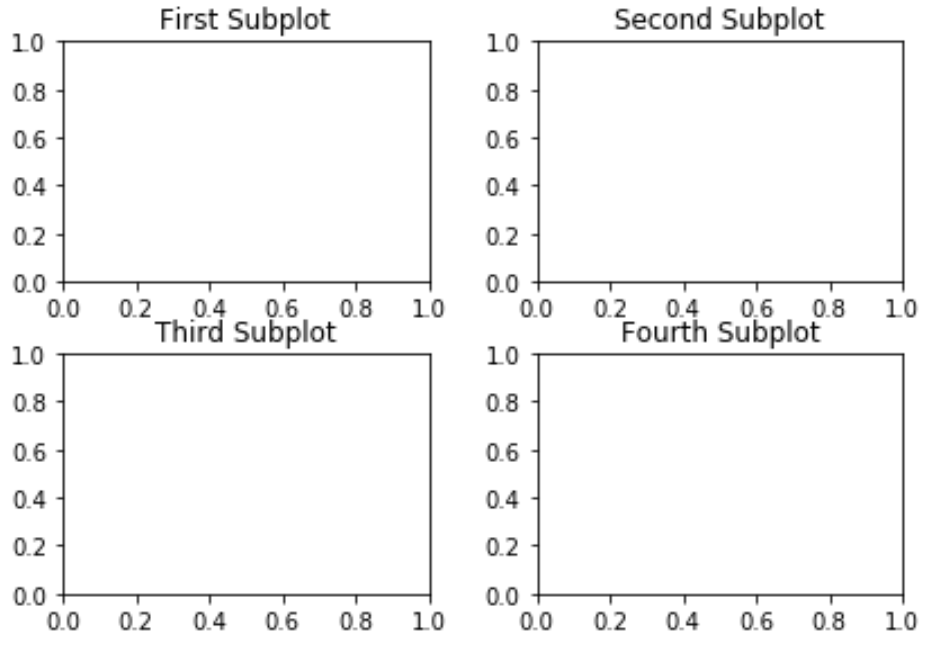
အချို့သောကိစ္စများတွင်၊ သင့်အပိုင်းခွဲတစ်ခုစီအတွက် ခေါင်းစဉ်များလည်း ရှိသည်။ ကံမကောင်းစွာဖြင့်၊ Tight_layout() function သည် subplot ခေါင်းစဉ်များကို ထပ်နေစေတတ်သည်-
 import matplotlib.pyplot as plt

#define subplots
fig, ax = plt. subplots (2, 2)
fig. tight_layout ()

#define subplot titles
ax[0, 0]. set_title ('First Subplot')
ax[0, 1]. set_title ('Second Subplot')
ax[1, 0]. set_title ('Third Subplot')
ax[1, 1]. set_title ('Fourth Subplot')

#display subplots
plt. show ()
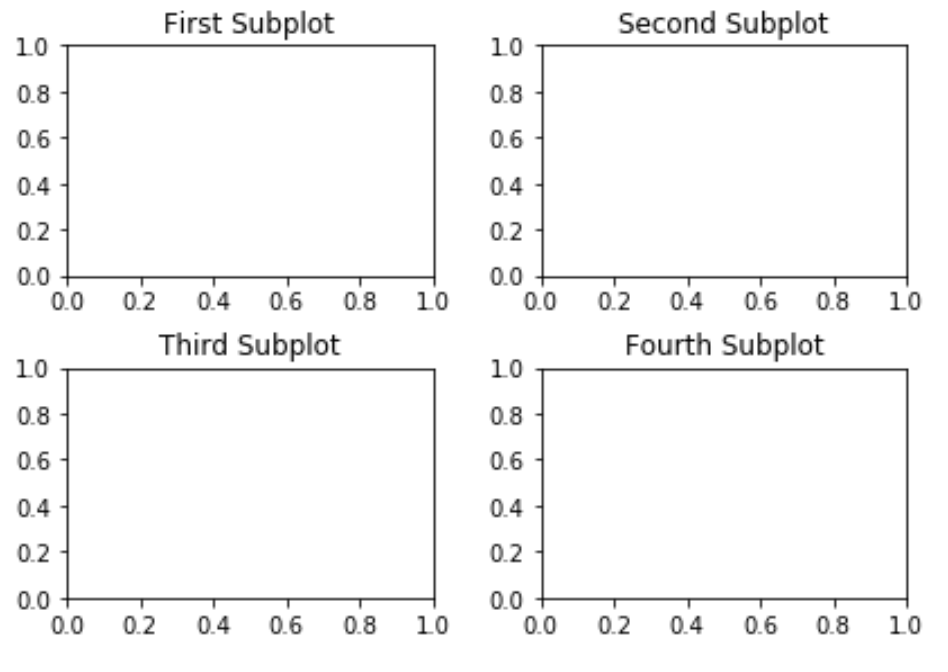
၎င်းကိုပြင်ဆင်ရန်နည်းလမ်းမှာ h_pad အငြင်းအခုံကို အသုံးပြု၍ အပိုင်းခွဲများကြား အမြင့်ကွက်လပ်ကို တိုးမြှင့်ရန်ဖြစ်သည်။
 import matplotlib.pyplot as plt

#define subplots
fig, ax = plt. subplots (2, 2)
fig. tight_layout (h_pad= 2 )

#define subplot titles
ax[0, 0]. set_title ('First Subplot')
ax[0, 1]. set_title ('Second Subplot')
ax[1, 0]. set_title ('Third Subplot')
ax[1, 1]. set_title ('Fourth Subplot')

#display subplots
plt. show ()
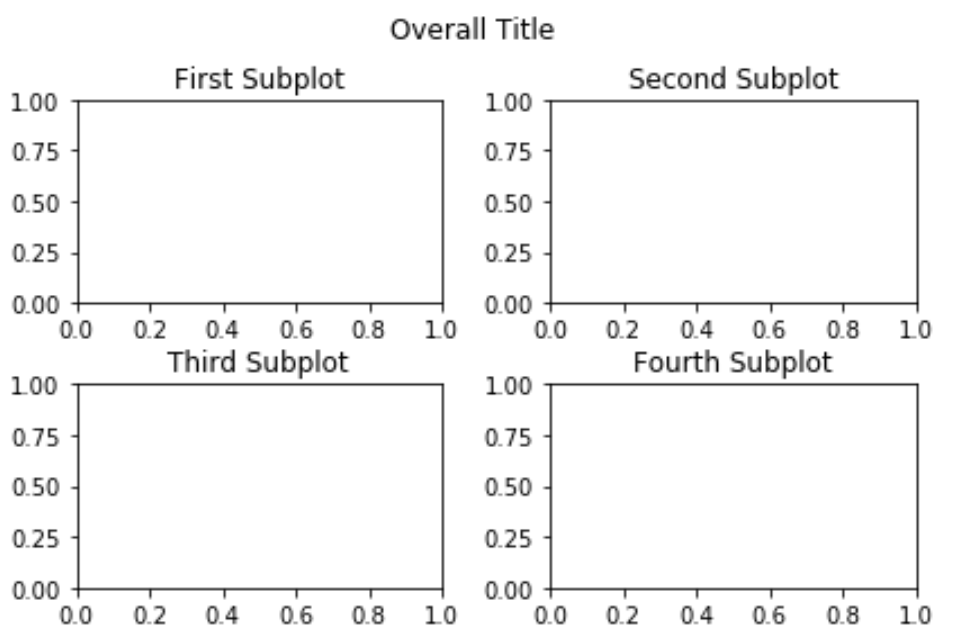
ခေါင်းစဉ်အကွာအဝေးတစ်ခုလုံးကို ချိန်ညှိပါ။
သင့်တွင် ခေါင်းစဉ်တစ်ခုလုံးရှိပါက၊ subplots_adjust() လုပ်ဆောင်ချက်ကို အသုံးပြု၍ အပိုင်းခွဲခေါင်းစဉ်များနှင့် ထပ်နေမည်မဟုတ်ကြောင်း သေချာစေရန်အတွက်၊
 import matplotlib.pyplot as plt

#define subplots
fig, ax = plt. subplots (2, 2)
fig. tight_layout (h_pad= 2 )

#define subplot titles
ax[0, 0]. set_title ('First Subplot')
ax[0, 1]. set_title ('Second Subplot')
ax[1, 0]. set_title ('Third Subplot')
ax[1, 1]. set_title ('Fourth Subplot')

#add overall title and adjust it so that it doesn't overlap with subplot titles
fig.suptitle(' Overall Title ')
plt.subplots_adjust(top= 0.85 )

#display subplots
plt. show ()
Matplotlib သင်ခန်းစာများကို ဤနေရာတွင် သင်ရှာဖွေနိုင်ပါသည်။
စာရေးသူအကြောင်း
Benjamin Anderson
မင်္ဂလာပါ၊ ကျွန်ုပ်သည် အငြိမ်းစား စာရင်းအင်း ပါမောက္ခ ဘင်ဂျမင်ဖြစ်ပြီး သီးသန့် Statorials ဆရာအဖြစ် လှည့်ပတ်ပါသည်။ စာရင်းဇယားနယ်ပယ်တွင် ကျယ်ပြန့်သောအတွေ့အကြုံနှင့် ကျွမ်းကျင်မှုနှင့်အတူ၊ Statorials မှတစ်ဆင့် ကျောင်းသားများကို ခွန်အားဖြစ်စေရန်အတွက် ကျွန်ုပ်၏အသိပညာကို မျှဝေလိုပါသည်။ ပိုသိတယ်။