Matplotlib တွင် x ဝင်ရိုးတန်ဖိုးများသတ်မှတ်နည်း
Matplotlib ရှိ ကွက်တစ်ခုအတွက် X ဝင်ရိုးတန်ဖိုးများကို သတ်မှတ်ရန် အောက်ပါအထားအသိုကို သင်အသုံးပြုနိုင်သည်-
 #specify x-axis locations
x_ticks = [2, 4, 6, 8, 10]

#specify x-axis labels
x_labels = ['A', 'B', 'C', 'D', 'E']

#add x-axis values to plot
plt. xticks (ticks=x_ticks, labels=x_labels)
အောက်ပါဥပမာများသည် ဤ syntax ကိုလက်တွေ့တွင်မည်သို့အသုံးပြုရမည်ကိုပြသထားသည်။
ဥပမာ 1- X-axis တန်ဖိုးများကို ညီတူညီမျှ ကြားကာလတွင် သတ်မှတ်ပါ။
အောက်ပါကုဒ်သည် Matplotlib ရှိ X ဝင်ရိုးတန်ဖိုးများကို တူညီသောအကွာအဝေးတွင် သတ်မှတ်နည်းကို ပြသသည်-
 import matplotlib. pyplot as plt

#define x and y
x = [1, 4, 10]
y = [5, 11, 27]

#create plot of x and y
plt. plot (x, y)

#specify x-axis locations
x_ticks = [2, 4, 6, 8, 10]

#specify x-axis labels
x_labels = ['A', 'B', 'C', 'D', 'E']

#add x-axis values to plot
plt. xticks (ticks=x_ticks, labels=x_labels)
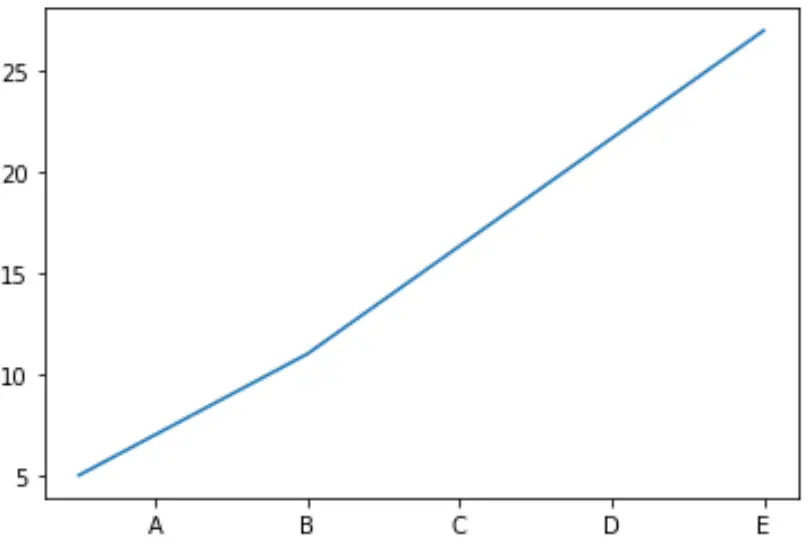
X ဝင်ရိုးတန်ဖိုးတစ်ခုစီသည် ညီမျှသောကြားကာလတွင် ပေါ်လာကြောင်း သတိပြုပါ။
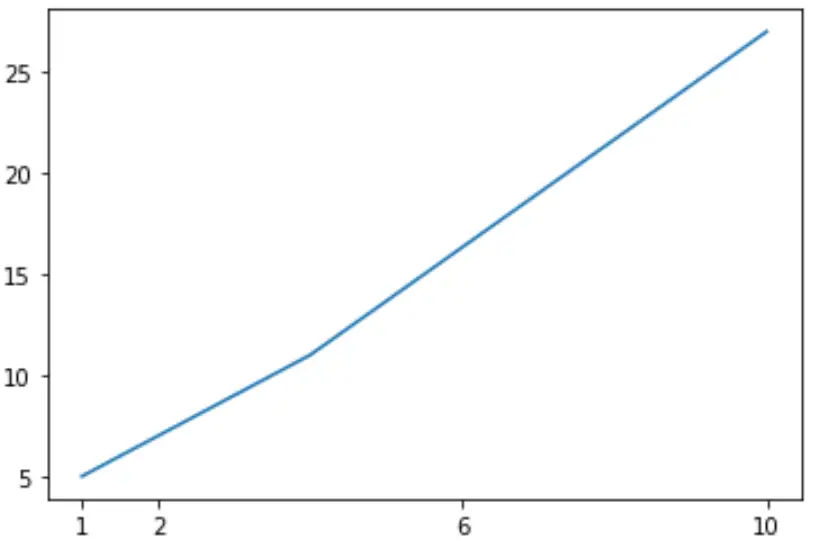
ဥပမာ 2- မညီမျှသော ကြားကာလများတွင် X-Axis တန်ဖိုးများကို သတ်မှတ်ပါ။
အောက်ပါကုဒ်သည် Matplotlib ရှိ မညီမျှသောအချိန်များတွင် X ဝင်ရိုးတန်ဖိုးများကို သတ်မှတ်နည်းကို ပြသသည်-
 import matplotlib. pyplot as plt

#define x and y
x = [1, 4, 10]
y = [5, 11, 27]

#create plot of x and y
plt. plot (x, y)

#specify x-axis locations
x_ticks = [1, 2, 6, 10]

#specify x-axis labels
x_labels = [1, 2, 6, 10]

#add x-axis values to plot
plt. xticks (ticks=x_ticks, labels=x_labels)
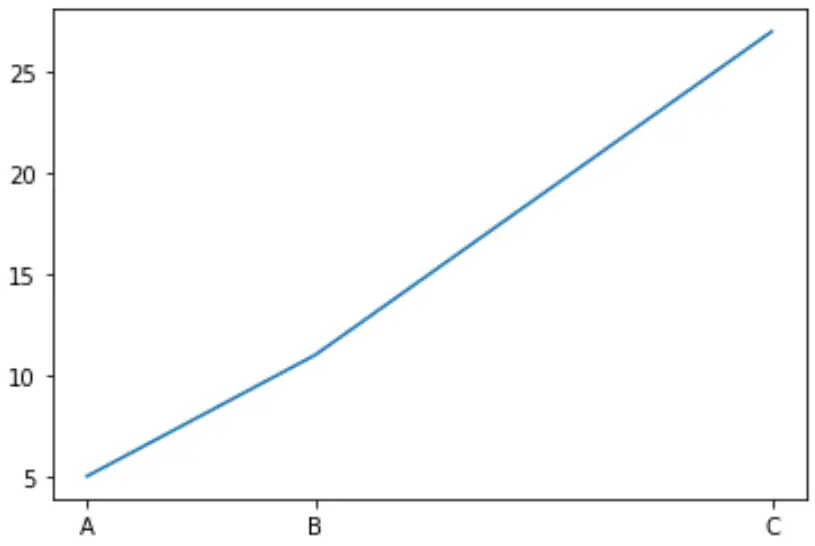
ဥပမာ 3- X-Axis တန်ဖိုးများကို Data Points တွင်သာ သတ်မှတ်ပါ။
အောက်ပါကုဒ်သည် ဒေတာအချက်များတွင် X ဝင်ရိုးတန်ဖိုးများကို သတ်မှတ်နည်းကို ပြသသည်-
 import matplotlib. pyplot as plt

#define x and y
x = [1, 4, 10]
y = [5, 11, 27]

#create plot of x and y
plt. plot (x, y)

#specify x-axis labels
x_labels = ['A', 'B', 'C']

#add x-axis values to plot
plt. xticks (ticks=x, labels=x_labels)
မှတ်ချက်- plt.xticks() လုပ်ဆောင်ချက်အတွက် စာရွက်စာတမ်းအပြည့်အစုံကို ဤနေရာတွင် ရှာတွေ့နိုင်ပါသည်။
ထပ်လောင်းအရင်းအမြစ်များ
Matplotlib တွင် ဝင်ရိုးအပိုင်းအခြားများ သတ်မှတ်နည်း
Matplotlib ရှိ checkmark အညွှန်းများ၏ ဖောင့်အရွယ်အစားကို သတ်မှတ်နည်း
ပုံတစ်ခုတည်းတွင် Matplotlib ကွက်များစွာကို ဖန်တီးနည်း
စာရေးသူအကြောင်း
Benjamin Anderson
မင်္ဂလာပါ၊ ကျွန်ုပ်သည် အငြိမ်းစား စာရင်းအင်း ပါမောက္ခ ဘင်ဂျမင်ဖြစ်ပြီး သီးသန့် Statorials ဆရာအဖြစ် လှည့်ပတ်ပါသည်။ စာရင်းဇယားနယ်ပယ်တွင် ကျယ်ပြန့်သောအတွေ့အကြုံနှင့် ကျွမ်းကျင်မှုနှင့်အတူ၊ Statorials မှတစ်ဆင့် ကျောင်းသားများကို ခွန်အားဖြစ်စေရန်အတွက် ကျွန်ုပ်၏အသိပညာကို မျှဝေလိုပါသည်။ ပိုသိတယ်။