Matplotlib တွင် ချောမွေ့သော မျဉ်းကွေးကို မည်သို့ဆွဲမည်နည်း။
မျဉ်းဂရပ်တစ်ခုအတွက် Matplotlib တွင် ချောမွေ့သောမျဉ်းကွေးတစ်ခုကို မကြာခဏ ရေးဆွဲလိုပေမည်။ ကံကောင်းထောက်မစွာ၊ ၎င်းသည် အောက်ပါ SciPy လုပ်ဆောင်ချက်များကို အသုံးပြု၍ လုပ်ဆောင်ရန် လွယ်ကူသည်။
ဤသင်ခန်းစာတွင် ဤလုပ်ဆောင်ချက်များကို လက်တွေ့အသုံးချနည်းကို ရှင်းပြထားသည်။
ဥပမာ- Matplotlib တွင် ချောမွေ့သောမျဉ်းကွေးတစ်ခုကို ပုံဖော်ခြင်း။
အောက်ပါကုဒ်သည် ဒေတာအစုတစ်ခုအတွက် ရိုးရှင်းသောမျဉ်းဇယားကို ဖန်တီးနည်းကို ပြသသည်-
 import numpy as np
import matplotlib.pyplot as plt

#create data
x = np.array([1, 2, 3, 4, 5, 6, 7, 8])
y = np.array([4, 9, 12, 30, 45, 88, 140, 230])

#create line chart
plt. plot (x,y)
plt. show ()
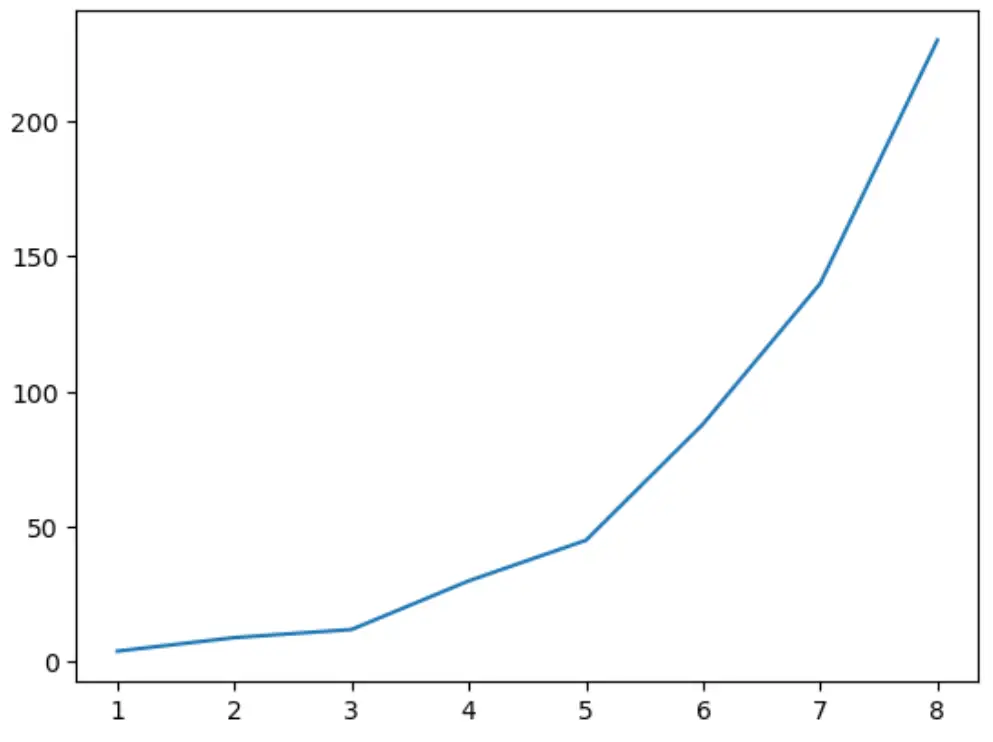
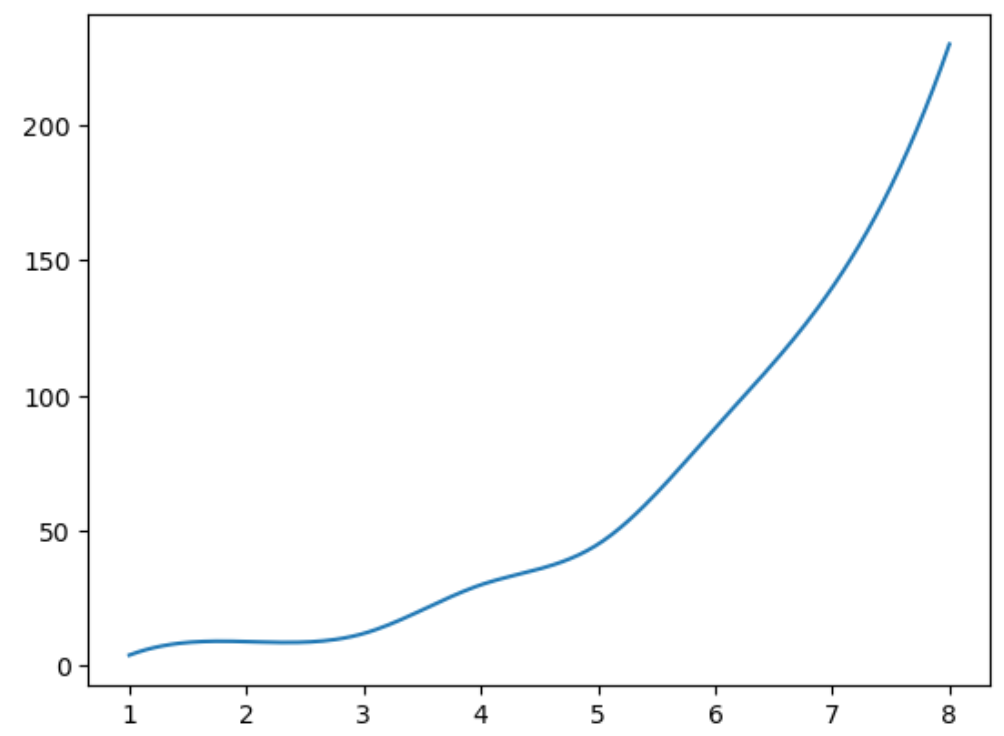
အရင်းခံဒေတာသည် ချောမွေ့သောမျဉ်းမလိုက်နာသောကြောင့် မျဉ်းဇယားသည် လုံး၀ချောမွေ့ခြင်းမရှိကြောင်း သတိပြုပါ။ ဤဒေတာအတွဲအတွက် ချောမွေ့သောမျဉ်းကွေးကို ဖန်တီးရန် အောက်ပါကုဒ်ကို ကျွန်ုပ်တို့ အသုံးပြုနိုင်ပါသည်။
 from scipy.interpolate import make_interp_spline, BSpline

#createdata
x = np.array([1, 2, 3, 4, 5, 6, 7, 8])
y = np.array([4, 9, 12, 30, 45, 88, 140, 230])

#define x as 200 equally spaced values between the min and max of original x
xnew = np. linspace ( x.min (), x.max (), 200 )

#define spline
spl = make_interp_spline (x, y, k= 3 )
y_smooth = spl (xnew)

#create smooth line chart
plt. plot (xnew, y_smooth)
plt. show ()
k argument အတွက် သင်အသုံးပြုသည့် degree ပိုမြင့်လေ၊ “ wavy” မျဉ်းကွေး ပိုများလာမည်ကို သတိပြုပါ။ ဥပမာအားဖြင့်၊ အောက်ပါဂရပ်ကို k=7 ဖြင့် သုံးသပ်ပါ။
 from scipy.interpolate import make_interp_spline, BSpline

#createdata
x = np.array([1, 2, 3, 4, 5, 6, 7, 8])
y = np.array([4, 9, 12, 30, 45, 88, 140, 230])

#define x as 200 equally spaced values between the min and max of original x
xnew = np. linspace ( x.min (), x.max (), 200 )

#define spline with degree k=7
spl = make_interp_spline (x, y, k= 7 )
y_smooth = spl (xnew)

#create smooth line chart
plt. plot (xnew, y_smooth)
plt. show ()
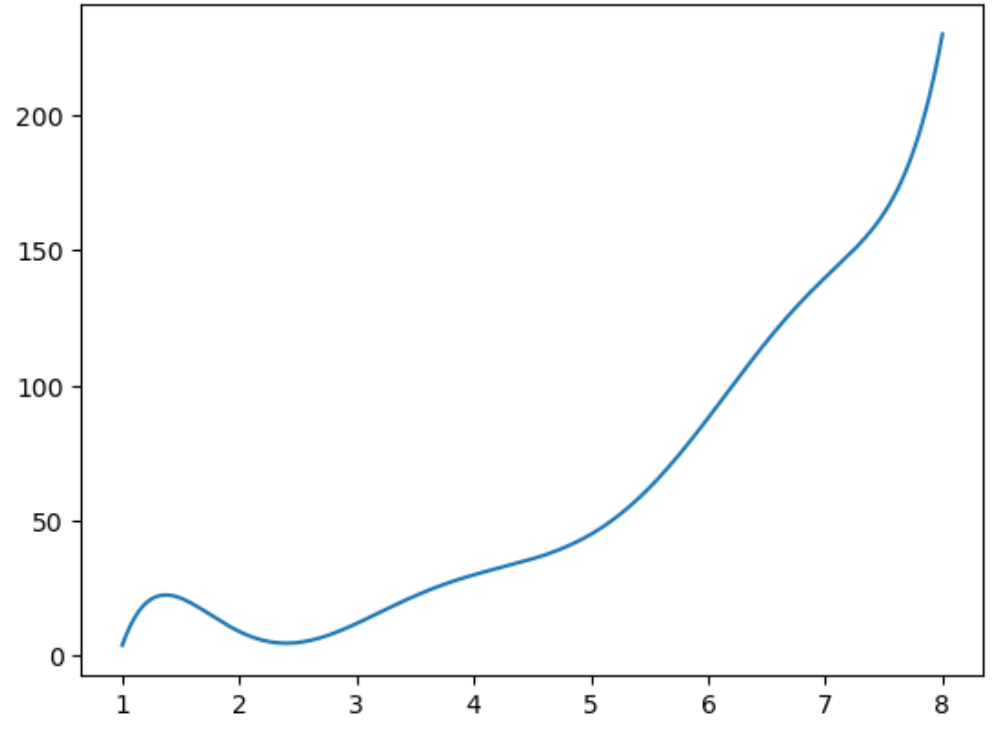
မျဉ်းကြောင်းကို သင်မည်ကဲ့သို့ ကွေးကောက်စေလိုသောအပေါ်မူတည်၍ k တန်ဖိုးကို ပြောင်းလဲနိုင်သည်။
ထပ်လောင်းအရင်းအမြစ်များ
Matplotlib ကွက်များတွင် ဂရစ်လိုင်းများပြသနည်း
Matplotlib ကွက်များမှ tick များကိုမည်သို့ဖယ်ရှားနည်း
လော့ဂရစ်သမ်စကေးများဖြင့် Matplotlib ကွက်များကို ဖန်တီးနည်း
စာရေးသူအကြောင်း
Benjamin Anderson
မင်္ဂလာပါ၊ ကျွန်ုပ်သည် အငြိမ်းစား စာရင်းအင်း ပါမောက္ခ ဘင်ဂျမင်ဖြစ်ပြီး သီးသန့် Statorials ဆရာအဖြစ် လှည့်ပတ်ပါသည်။ စာရင်းဇယားနယ်ပယ်တွင် ကျယ်ပြန့်သောအတွေ့အကြုံနှင့် ကျွမ်းကျင်မှုနှင့်အတူ၊ Statorials မှတစ်ဆင့် ကျောင်းသားများကို ခွန်အားဖြစ်စေရန်အတွက် ကျွန်ုပ်၏အသိပညာကို မျှဝေလိုပါသည်။ ပိုသိတယ်။