Matplotlib တွင် စက်ဝိုင်းပုံဆွဲနည်း (ဥပမာများဖြင့်)
အောက်ပါအထားအသိုကိုအသုံးပြုသည့် Circle() လုပ်ဆောင်ချက်ကို အသုံးပြု၍ Matplotlib ရှိ ကွက်ကွက်တစ်ခုသို့ စက်ဝိုင်းများကို အမြန်ထည့်နိုင်သည်-
matplotlib.patches.Circle(xy၊ အချင်းဝက်=5)
ရွှေ-
- xy- စက်ဝိုင်း၏ သြဒိနိတ်များ (x၊ y)
- အချင်းဝက်- စက်ဝိုင်း၏ အချင်းဝက်။ မူရင်းမှာ 5 ဖြစ်သည်။
ဤသင်ခန်းစာတွင် ဤလုပ်ဆောင်ချက်ကို လက်တွေ့အသုံးပြုခြင်း၏ နမူနာများစွာကို ပြသသည်-
ဥပမာ 1- စက်ဝိုင်းတစ်ခု ဖန်တီးပါ။
အောက်ပါကုဒ်သည် သြဒိနိတ်များ (x,y)(10,10) တွင်ရှိသော Matplotlib ကွက်ကွက်တစ်ခုပေါ်တွင် စက်ဝိုင်းတစ်ခုဖန်တီးနည်းကို ပြသသည် ။
 import matplotlib. pyplot as plt

#set axis limits of plot (x=0 to 20, y=0 to 20)
plt. axis ([0, 20, 0, 20])

#create circle with (x, y) coordinates at (10, 10)
c=plt. Circle ((10, 10))

#add circle to plot (gca means "get current axis")
plt. gca (). add_artist (c)
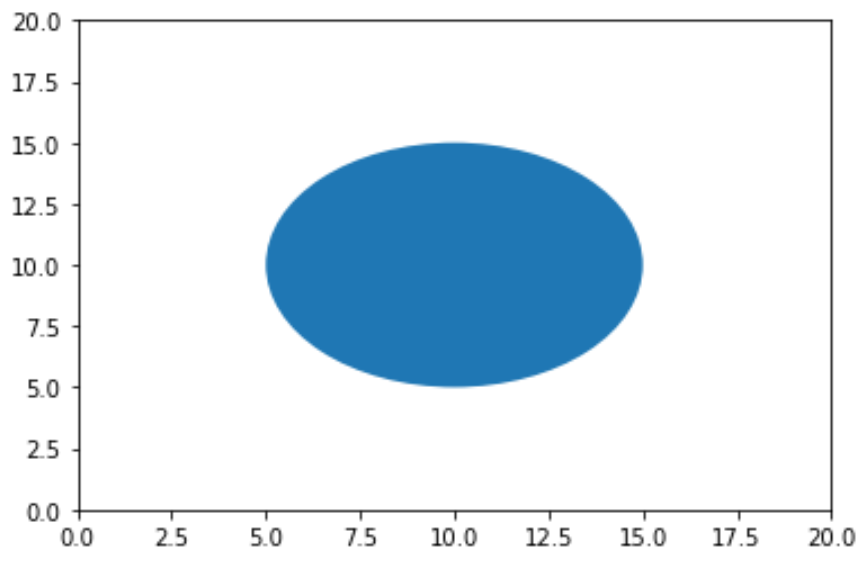
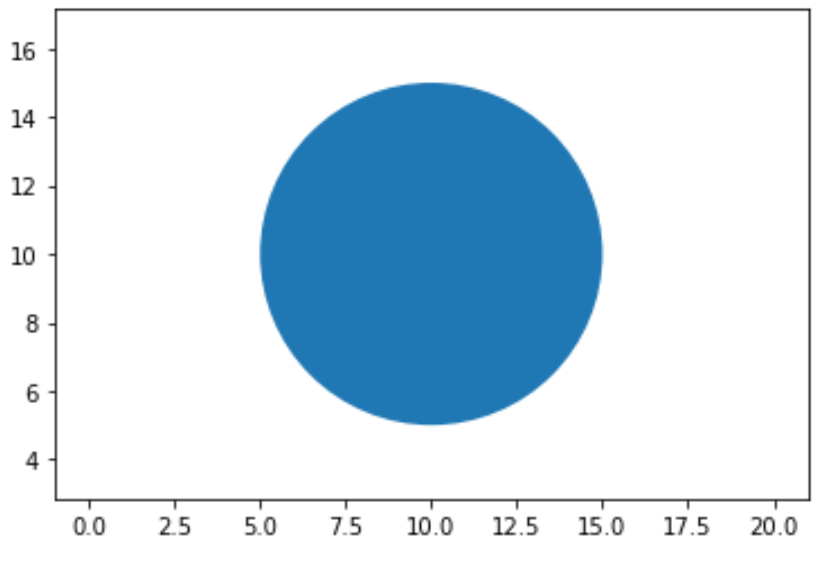
ပုံမှန်အားဖြင့်၊ Matplotlib ကွက်ကွက်တစ်ခု၏ ဝင်ရိုးတစ်ခုသည် ယေဘုယျအားဖြင့် ဒေတာယူနစ်တစ်ခုလျှင် pixels ပိုများသည်ကို ပြသသည်။ စက်ဝိုင်းတစ်ခုအား ellipse အစား စက်ဝိုင်းတစ်ခုအဖြစ် ပေါ်စေရန်၊ သင်သည် အောက်ပါအတိုင်း plt.axis(“ equal” ) အငြင်းအခုံကို အသုံးပြုရပါမည်။
 import matplotlib. pyplot as plt

#set axis limits of plot (x=0 to 20, y=0 to 20)
plt. axis ([0, 20, 0, 20])
plt. axis (" equal ")

#create circle with (x, y) coordinates at (10, 10)
c=plt. Circle ((10, 10))

#add circle to plot (gca means "get current axis")
plt. gca (). add_artist (c)
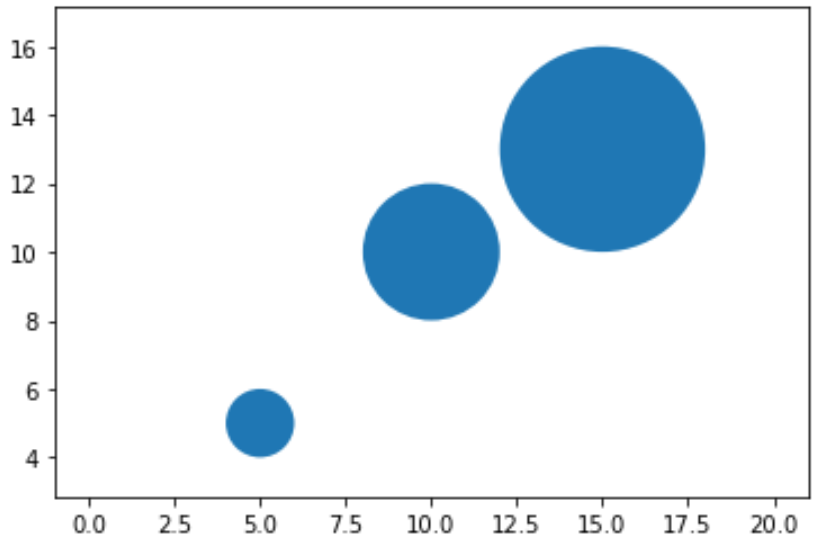
ဥပမာ 2- စက်ဝိုင်းများစွာ ဖန်တီးပါ။
အောက်ပါကုဒ်သည် Matplotlib ကွက်တစ်ခုတွင် စက်ဝိုင်းများစွာကို ဖန်တီးနည်းကို ပြသသည်-
 import matplotlib. pyplot as plt

#set axis limits of plot (x=0 to 20, y=0 to 20)
plt. axis ([0, 20, 0, 20])
plt. axis (" equal ")

#define circles
c1=plt. Circle ((5, 5), radius= 1 )
c2=plt. Circle ((10, 10), radius= 2 )
c3=plt. Circle ((15, 13), radius= 3 )

#add circles to plot
plt. gca (). add_artist (c1)
plt. gca (). add_artist (c2)
plt. gca (). add_artist (c3)
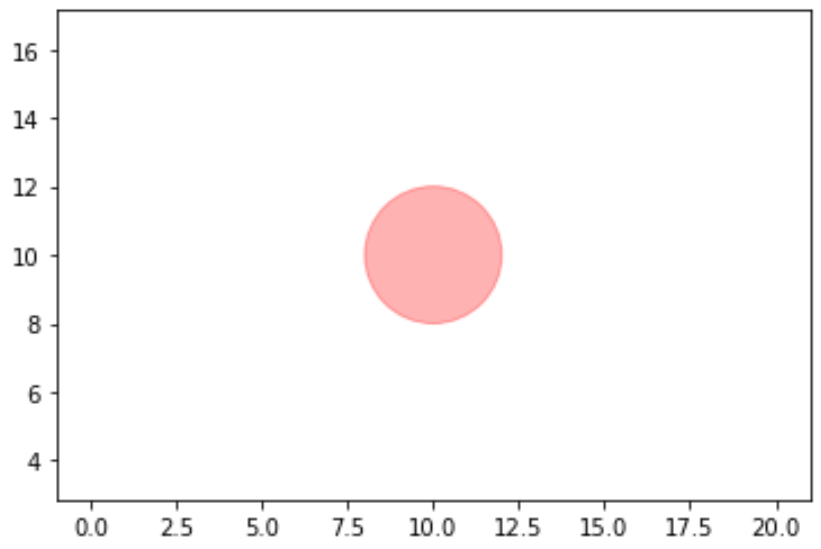
ဥပမာ 3- စက်ဝိုင်းပုံသဏ္ဍာန်ကို ပြောင်းပါ။
Matplotlib ရှိ စက်ဝိုင်းပုံသဏ္ဍာန်ကို ပြောင်းလဲရန် အောက်ပါ အကြောင်းပြချက်များကို သင်အသုံးပြုနိုင်ပါသည်။
- အချင်းဝက်- စက်ဝိုင်း၏ အချင်းဝက်ကို သတ်မှတ်ပါ။
- color: စက်ဝိုင်း၏အရောင်ကိုသတ်မှတ်ပါ။
- alpha- စက်ဝိုင်း၏ ပွင့်လင်းမြင်သာမှုကို သတ်မှတ်ပါ။
အောက်ပါကုဒ်သည် ဤအငြင်းအခုံများစွာကို တစ်ပြိုင်နက်အသုံးပြုပုံ ဥပမာတစ်ခုကို ပြသည်-
 import matplotlib. pyplot as plt

#set axis limits of plot (x=0 to 20, y=0 to 20)
plt. axis ([0, 20, 0, 20])
plt. axis (" equal ")

#create circle with (x, y) coordinates at (10, 10)
c=plt. Circle ((10, 10), radius= 2 , color=' red ', alpha= .3 )

#add circle to plot (gca means "get current axis")
plt. gca (). add_artist (c)
စက်ဝိုင်းများ၏အရောင်ကို သတ်မှတ်ရန် စိတ်ကြိုက် hexadecimal အရောင်ကုဒ်များကိုလည်း အသုံးပြုနိုင်ကြောင်း သတိပြုပါ။
စာရေးသူအကြောင်း
Benjamin Anderson
မင်္ဂလာပါ၊ ကျွန်ုပ်သည် အငြိမ်းစား စာရင်းအင်း ပါမောက္ခ ဘင်ဂျမင်ဖြစ်ပြီး သီးသန့် Statorials ဆရာအဖြစ် လှည့်ပတ်ပါသည်။ စာရင်းဇယားနယ်ပယ်တွင် ကျယ်ပြန့်သောအတွေ့အကြုံနှင့် ကျွမ်းကျင်မှုနှင့်အတူ၊ Statorials မှတစ်ဆင့် ကျောင်းသားများကို ခွန်အားဖြစ်စေရန်အတွက် ကျွန်ုပ်၏အသိပညာကို မျှဝေလိုပါသည်။ ပိုသိတယ်။