Matplotlib တွင် ဒေါင်လိုက်မျဉ်းဆွဲနည်း (ဥပမာများဖြင့်)
Matplotlib တွင် ဒေါင်လိုက်မျဉ်းတစ်ခုဆွဲရန် အောက်ပါအထားအသိုကိုသုံးနိုင်သည်။
 import matplotlib. pyplot as plt

#draw vertical line at x=2
plt. axvline (x=2)
အောက်ဖော်ပြပါနမူနာများသည် အောက်ပါ pandas DataFrame နှင့် လက်တွေ့တွင် ဤ syntax ကိုမည်သို့အသုံးပြုရမည်ကို ပြသသည် ။
 import pandas as pd

#createDataFrame
df = pd. DataFrame ({' x ': [1, 2, 3, 4, 5, 6, 7, 8],
                   ' y ': [5, 7, 8, 15, 26, 39, 45, 40]})

#view DataFrame
df

	x y
0 1 5
1 2 7
2 3 8
3 4 15
4 5 26
5 6 39
6 7 45
7 8 40
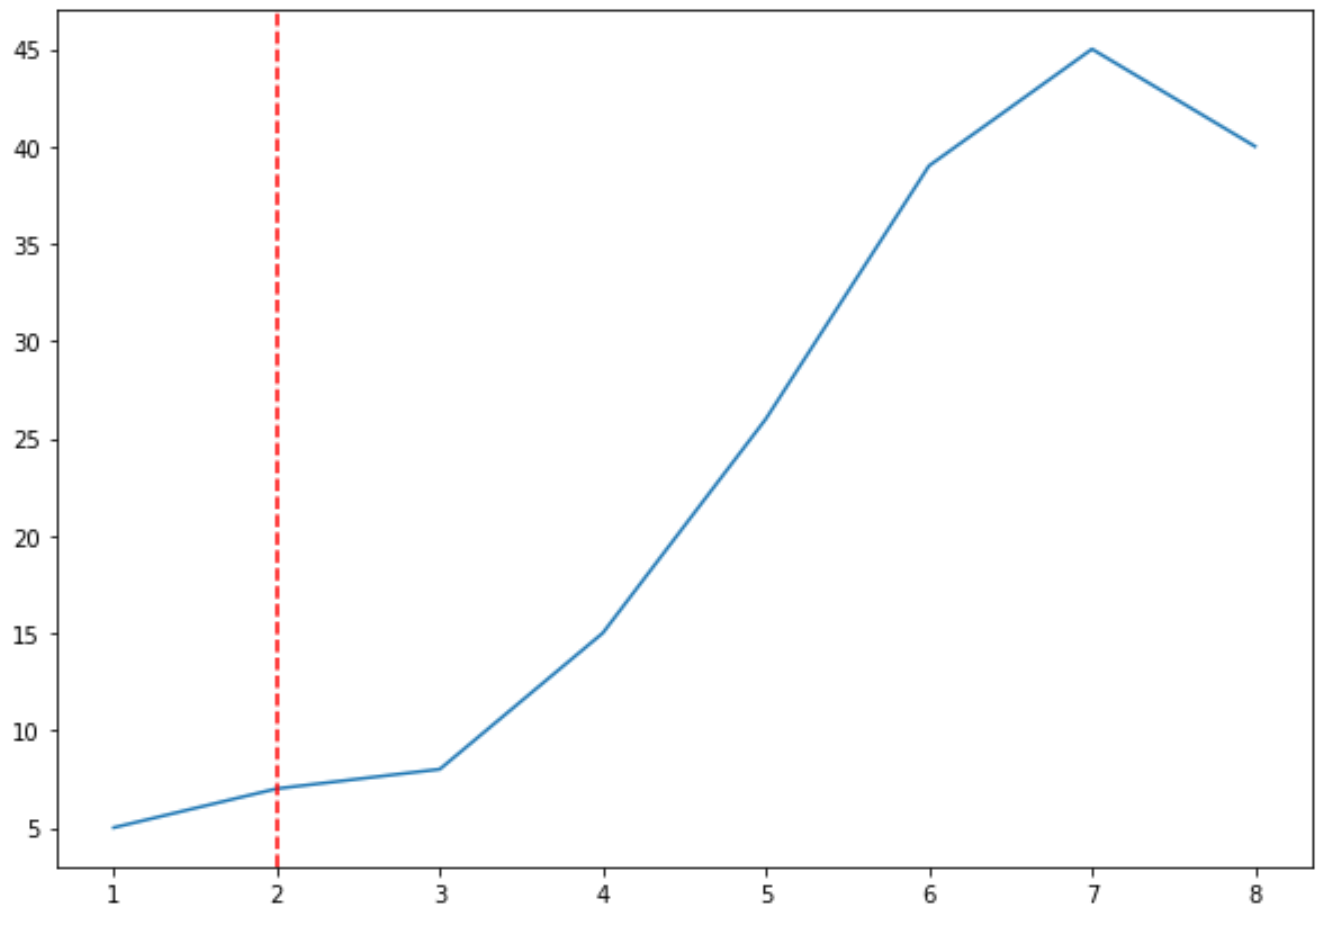
ဥပမာ 1- ဒေါင်လိုက်မျဉ်းဆွဲခြင်း။
အောက်ပါကုဒ်သည် Matplotlib ကွက်ပေါ်တွင် ဒေါင်လိုက်မျဉ်းဆွဲနည်းကို ပြသသည်-
 import matplotlib. pyplot as plt

#create line plot
plt. plot (df. x , df. y )

#add vertical line at x=2
plt. axvline (x=2, color=' red ', linestyle=' -- ')
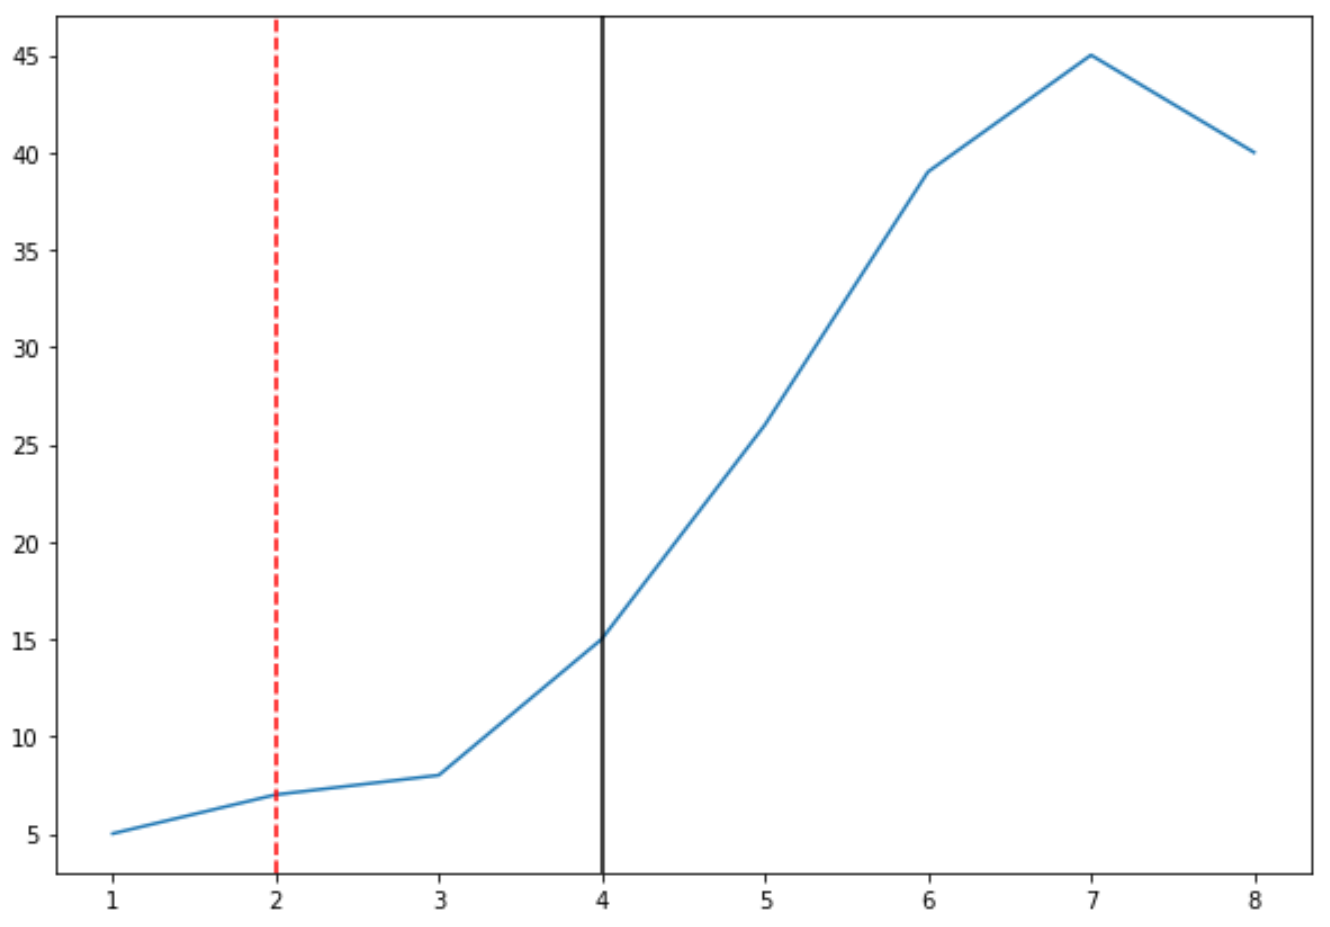
ဥပမာ 2- ဒေါင်လိုက်မျဉ်းများစွာဆွဲပါ။
အောက်ဖော်ပြပါကုဒ်သည် Matplotlib ကွက်တစ်ခုတွင် ဒေါင်လိုက်လိုင်းများစွာကို မည်သို့ဆွဲရမည်ကို ပြသသည်-
 import matplotlib. pyplot as plt

#create line plot
plt. plot (df. x , df. y )

#add vertical line at x=2
plt. axvline (x=2, color=' red ', linestyle=' -- ')

#add vertical line at x=4
plt. axvline (x=4, color=' black ', linestyle=' - ')
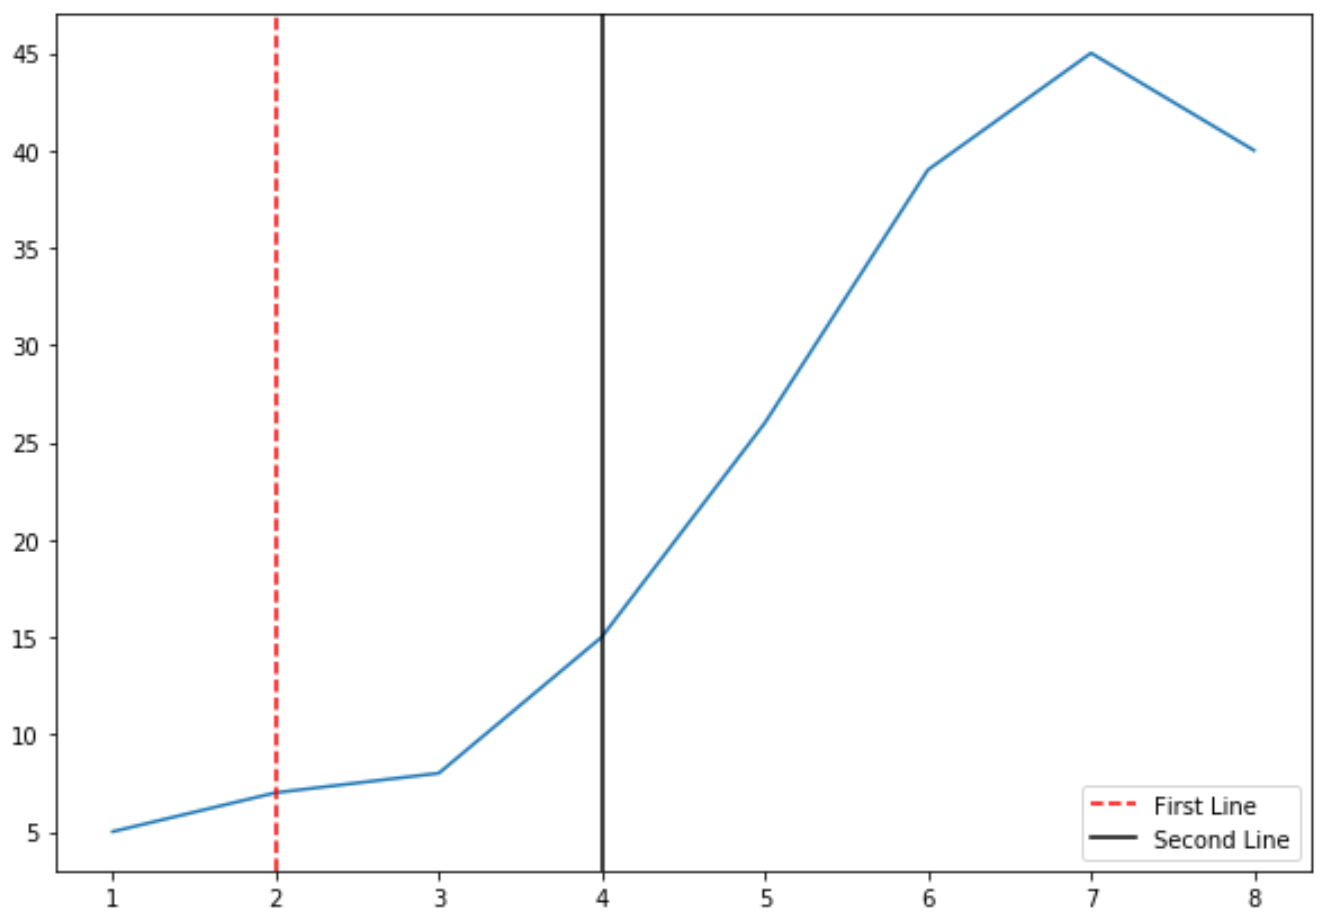
ဥပမာ 3- ဒဏ္ဍာရီတစ်ခုဖြင့် ဒေါင်လိုက်လိုင်းများစွာကို ဆွဲပါ။
အောက်ဖော်ပြပါကုဒ်သည် Matplotlib ကွက်ကွက်တစ်ခုတွင် ဒေါင်လိုက်မျဥ်းများစွာကို မည်သို့ဆွဲရမည်ကို ပြသပြီး မျဉ်းကြောင်းများကို ပိုမိုလွယ်ကူစွာအနက်ပြန်ဆိုနိုင်စေရန် ဒဏ္ဍာရီကို ထည့်သွင်းဖော်ပြသည်-
 import matplotlib. pyplot as plt

#create line plot
plt. plot (df. x , df. y )

#add vertical line at x=2
plt. axvline (x=2, color=' red ', linestyle=' -- ', label=' First Line ')

#add vertical line at x=4
plt. axvline (x=4, color=' black ', linestyle=' - ', label=' Second Line ')

#add legend
plt. legend ()
မှတ်ချက်- သင်သည် ဒေါင်လိုက်လိုင်းများအတွက် အသုံးချနိုင်သော ဖြစ်နိုင်ခြေရှိသော လိုင်းအရောင်များနှင့် ပုံစံများစာရင်းအတွက် Matplotlib စာရွက်စာတမ်းကို ကိုးကားပါ။
ထပ်လောင်းအရင်းအမြစ်များ
Matplotlib တွင် အလျားလိုက်မျဉ်းဆွဲနည်း
Matplotlib တွင် စာကြောင်းများစွာကို ဘယ်လိုဆွဲမလဲ။
Matplotlib တွင် အချိန်စီးရီးတစ်ခုကို ဘယ်လိုဆွဲမလဲ။
Matplotlib တွင် စတုဂံပုံဆွဲနည်း
Matplotlib တွင်မြှားဆွဲနည်း
စာရေးသူအကြောင်း
Benjamin Anderson
မင်္ဂလာပါ၊ ကျွန်ုပ်သည် အငြိမ်းစား စာရင်းအင်း ပါမောက္ခ ဘင်ဂျမင်ဖြစ်ပြီး သီးသန့် Statorials ဆရာအဖြစ် လှည့်ပတ်ပါသည်။ စာရင်းဇယားနယ်ပယ်တွင် ကျယ်ပြန့်သောအတွေ့အကြုံနှင့် ကျွမ်းကျင်မှုနှင့်အတူ၊ Statorials မှတစ်ဆင့် ကျောင်းသားများကို ခွန်အားဖြစ်စေရန်အတွက် ကျွန်ုပ်၏အသိပညာကို မျှဝေလိုပါသည်။ ပိုသိတယ်။