Seaborn မှာ ဒဏ္ဍာရီတစ်ယောက်ရဲ့ အနေအထားကို ဘယ်လိုပြောင်းမလဲ။
အဏ္ဏဝါဇာတ်ကွက်တစ်ခုရှိ ဒဏ္ဍာရီတစ်ခု၏ အနေအထားကို ပြောင်းလဲရန်၊ သင်သည် plt.legend() အမိန့်ကို အသုံးပြုနိုင်သည်။
ဥပမာအားဖြင့်၊ သင်သည် ဇာတ်ကွက်၏ ညာဘက်အပေါ်ထောင့်တွင် ဒဏ္ဍာရီကို နေရာချရန် အောက်ပါ syntax ကို အသုံးပြုနိုင်သည်။
plt. legend (loc=' upper right ')
မူရင်းတည်နေရာသည် “ အကောင်းဆုံး” ဖြစ်သည် – ဤနေရာတွင် Matplotlib သည် ဒေတာအချက်များကို ဖုံးကွယ်ထားခြင်းမရှိသော ဒဏ္ဍာရီအတွက် တည်နေရာကို အလိုအလျောက်ရှာတွေ့သည်။
သို့သော်၊ သင်သည် အောက်ပါစာတန်းတည်နေရာများထဲမှ တစ်ခုကို သတ်မှတ်နိုင်သည်-
- ညာဘက်
- ဘယ်ဘက်အပေါ်ထောင့်မှာ
- ဘယ်ဘက်အောက်ခြေမှာ
- အောက်ခြေညာဘက်မှာ
- ညာဘက်
- ဘယ်ဘက်ဗဟို
- ညာယိမ်း
- အောက်ခြေဗဟို
- ထိပ်တန်းစင်တာ
- ဗဟို
ဒဏ္ဍာရီကို ဇာတ်ကွက်အပြင်ဘက်တွင် နေရာချရန် bbox_to_anchor() အငြင်းအခုံကိုလည်း သင်အသုံးပြုနိုင်ပါသည်။ ဥပမာအားဖြင့်၊ ဇာတ်ကွက်၏အပြင်ဘက်တွင် ဒဏ္ဍာရီကို ညာဘက်အပေါ်ထောင့်တွင် နေရာချရန် အောက်ပါအထားအသိုကို အသုံးပြုနိုင်သည်။
plt. legend (bbox_to_anchor=( 1.05 , 1 ), loc=' upper left ', borderaxespad= 0 )
အောက်ဖော်ပြပါ ဥပမာများသည် ဤနည်းလမ်းတစ်ခုစီကို လက်တွေ့အသုံးချနည်းကို ပြသထားသည်။
ဥပမာ 1- Seaborn ဇာတ်ကွက်အတွင်း ဒဏ္ဍာရီ၏ အနေအထားကို ပြောင်းပါ။
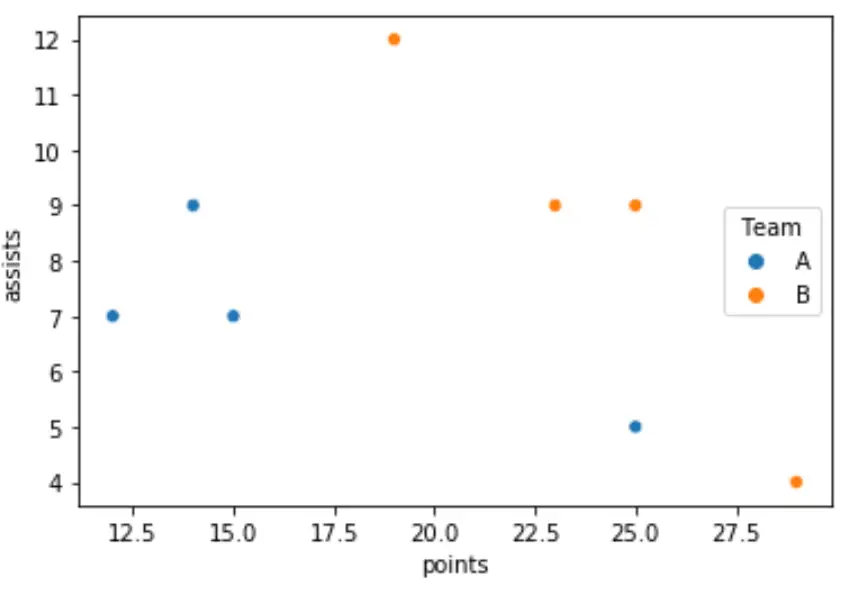
အောက်ဖော်ပြပါ ကုဒ်သည် ဒဏ္ဍာရီကို အဏ္ဏဝါဖြန့်ကျက်မှုတစ်ခု၏ ညာဘက်အလယ်ဗဟိုတွင် မည်သို့ထားရမည်ကို ပြသသည်-
 import pandas as pd
import seaborn as sns
import matplotlib. pyplot as plt

#create fake data
df = pd. DataFrame ({' points ': [25, 12, 15, 14, 19, 23, 25, 29],
                   ' assists ': [5, 7, 7, 9, 12, 9, 9, 4],
                   ' team ': ['A', 'A', 'A', 'A', 'B', 'B', 'B', 'B']})

#create scatterplot
sns. scatterplot (data=df, x=' points ', y=' assists ', hue=' team ')

#place legend in center right of plot
plt. legend (loc=' center right ', title=' Team ')
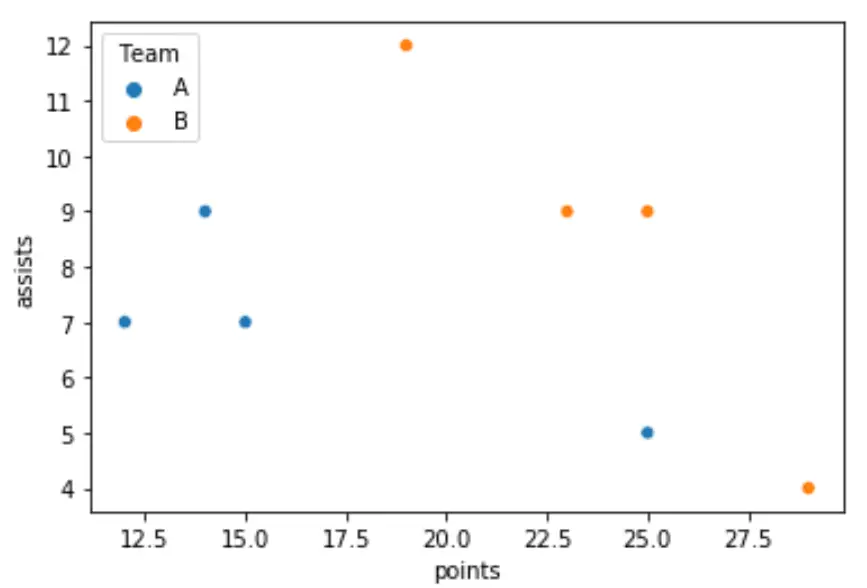
အောက်ဖော်ပြပါ ကုဒ်သည် ဒဏ္ဍာရီကို အဏ္ဏဝါဖြန့်ကျက်မှုတစ်ခု၏ ဘယ်ဘက်အပေါ်ဘက်တွင် မည်သို့ထားရမည်ကို ပြသသည်-
 #create scatterplot
sns. scatterplot (data=df, x=' points ', y=' assists ', hue=' team ')

#place legend in upper left of plot
plt. legend (loc=' upper left ', title=' Team ')
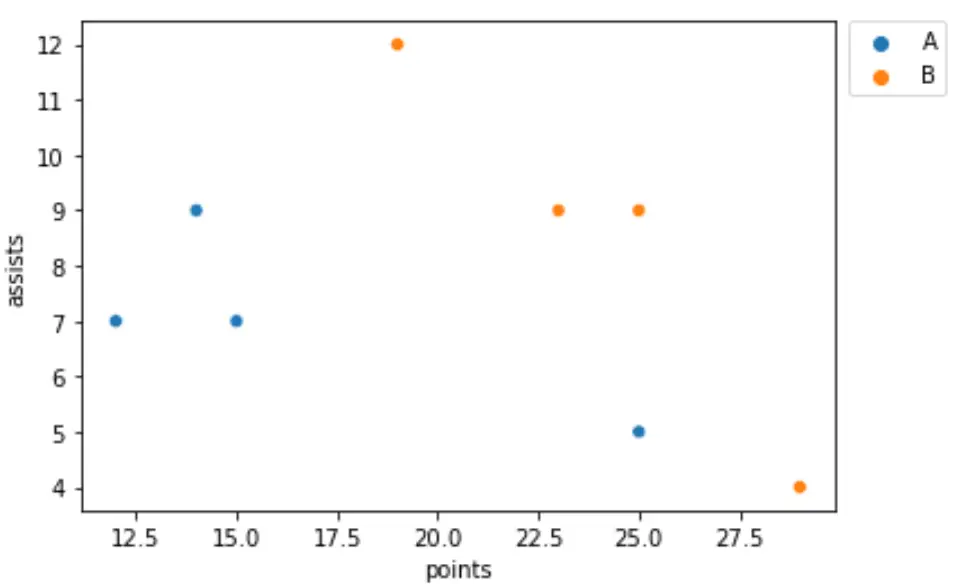
ဥပမာ 2- Seaborn ဇာတ်ကွက်ပြင်ပ ဒဏ္ဍာရီ၏ အနေအထားကို ပြောင်းပါ။
အဏ္ဏဝါဇာတ်ကွက်တစ်ခု၏ အပြင်ဘက်တွင် ဒဏ္ဍာရီကို ထားရှိရန်၊ ကျွန်ုပ်တို့သည် bbox_to_anchor() အငြင်းအခုံကို အသုံးပြုနိုင်သည်။
ဥပမာ၊ ဤနေရာတွင် ဒဏ္ဍာရီကို ဇာတ်ကွက်၏ ညာဘက်အပေါ်ထောင့်အပြင်ဘက်တွင် မည်သို့ထားရှိရမည်နည်း။
 import pandas as pd
import seaborn as sns
import matplotlib. pyplot as plt

#create fake data
df = pd. DataFrame ({' points ': [25, 12, 15, 14, 19, 23, 25, 29],
                   ' assists ': [5, 7, 7, 9, 12, 9, 9, 4],
                   ' team ': ['A', 'A', 'A', 'A', 'B', 'B', 'B', 'B']})

#create scatterplot
sns. scatterplot (data=df, x=' points ', y=' assists ', hue=' team ')

#place legend outside top right corner of plot
plt. legend (bbox_to_anchor=( 1.02 , 1 ), loc=' upper left ', borderaxespad= 0 )
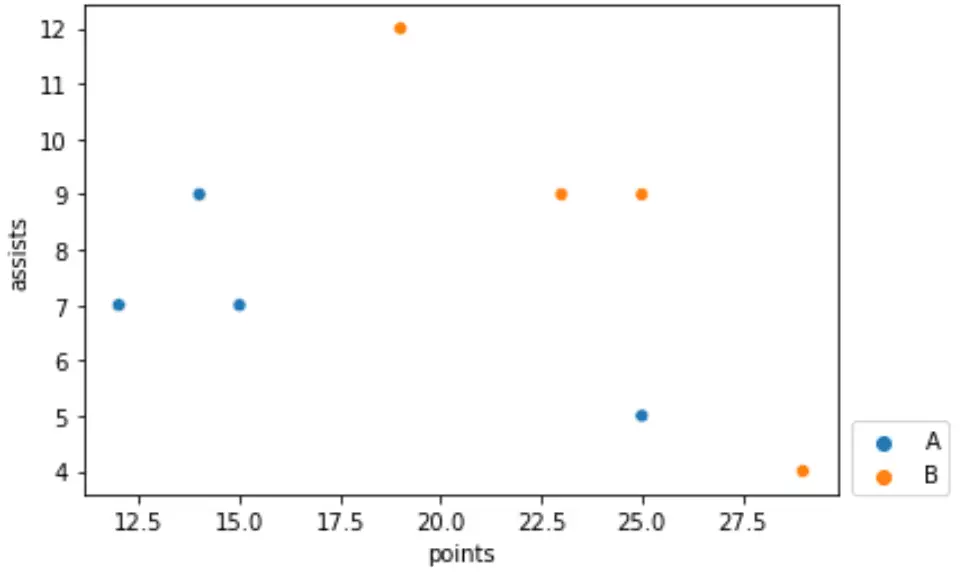
ဤသည်မှာ ဒဏ္ဍာရီကို ဇာတ်ကွက်၏အောက်ခြေညာဘက်ထောင့်အပြင်ဘက်တွင် မည်သို့ထားရှိရမည်နည်း၊
 #create scatterplot
sns. scatterplot (data=df, x=' points ', y=' assists ', hue=' team ')

#place legend outside bottom right corner of plot
plt. legend (bbox_to_anchor=( 1.02 , 0.15 ), loc=' upper left ', borderaxespad= 0 )
bbox_to_anchor() အငြင်းအခုံ၏အသေးစိတ်ရှင်းပြချက်အတွက် matplotlib စာရွက်စာတမ်းကို ကိုးကားပါ။
ထပ်လောင်းအရင်းအမြစ်များ
Seaborn ဇာတ်ကွက်၏ ပုံအရွယ်အစားကို ချိန်ညှိနည်း
Seaborn ကွက်တွင် ဝင်ရိုးအညွှန်းများကို မည်သို့ပြောင်းရမည်နည်း။
Seaborn ဇာတ်ကွက်တွင် ဒဏ္ဍာရီဖောင့်အရွယ်အစားကို မည်သို့ပြောင်းလဲမည်နည်း။
စာရေးသူအကြောင်း
Benjamin Anderson
မင်္ဂလာပါ၊ ကျွန်ုပ်သည် အငြိမ်းစား စာရင်းအင်း ပါမောက္ခ ဘင်ဂျမင်ဖြစ်ပြီး သီးသန့် Statorials ဆရာအဖြစ် လှည့်ပတ်ပါသည်။ စာရင်းဇယားနယ်ပယ်တွင် ကျယ်ပြန့်သောအတွေ့အကြုံနှင့် ကျွမ်းကျင်မှုနှင့်အတူ၊ Statorials မှတစ်ဆင့် ကျောင်းသားများကို ခွန်အားဖြစ်စေရန်အတွက် ကျွန်ုပ်၏အသိပညာကို မျှဝေလိုပါသည်။ ပိုသိတယ်။