Seaborn တွင် horizontal barplot ဖန်တီးနည်း (ဥပမာနှင့်အတူ)
seaborn တွင် အလျားလိုက် barplot တစ်ခုကို ဖန်တီးရန် အောက်ပါ အခြေခံ syntax ကို သင် အသုံးပြုနိုင်ပါသည်။
sns. barplot (x=df. values_var , y=df. group_var , orient=' h ')
orient=’h’ အငြင်းအခုံက Seaborn သည် ပုံသေဒေါင်လိုက်အစား ဘားများကို အလျားလိုက် ဦးတည်ရန် ပြောထားသည်။
အောက်ဖော်ပြပါ ဥပမာသည် ဤ syntax ကို လက်တွေ့တွင် မည်သို့အသုံးပြုရမည်ကို ပြသထားသည်။
ဥပမာ- Seaborn တွင် အလျားလိုက် barplot ဖန်တီးနည်း
ကုမ္ပဏီတစ်ခု၏ ဝန်ထမ်းအမျိုးမျိုးမှ ရောင်းချသည့် စုစုပေါင်းရောင်းချမှုဆိုင်ရာ အချက်အလက်များပါရှိသော အောက်ပါပန်ဒါ DataFrame ရှိသည်ဆိုပါစို့။
 import pandas as pd

#createDataFrame
df = pd. DataFrame ({' employee ': ['Andy', 'Bert', 'Chad', 'Doug', 'Eric', 'Frank'],
                   ' sales ': [22, 14, 9, 7, 29, 20]})

#view DataFrame
print (df)

  employee sales
0 Andy 22
1 Bert 14
2 Chad 9
3 Doug 7
4 Eric 29
5 Frank 20
ဝန်ထမ်းတစ်ဦးစီ၏ ရောင်းအားကို မြင်သာစေရန် အလျားလိုက် barplot တစ်ခုကို ဖန်တီးရန် အောက်ပါ syntax ကို အသုံးပြုနိုင်ပါသည်။
 import seaborn as sns

#create horizontal barplot
sns. barplot (x=df. sales , y=df. employee , orient=' h ')
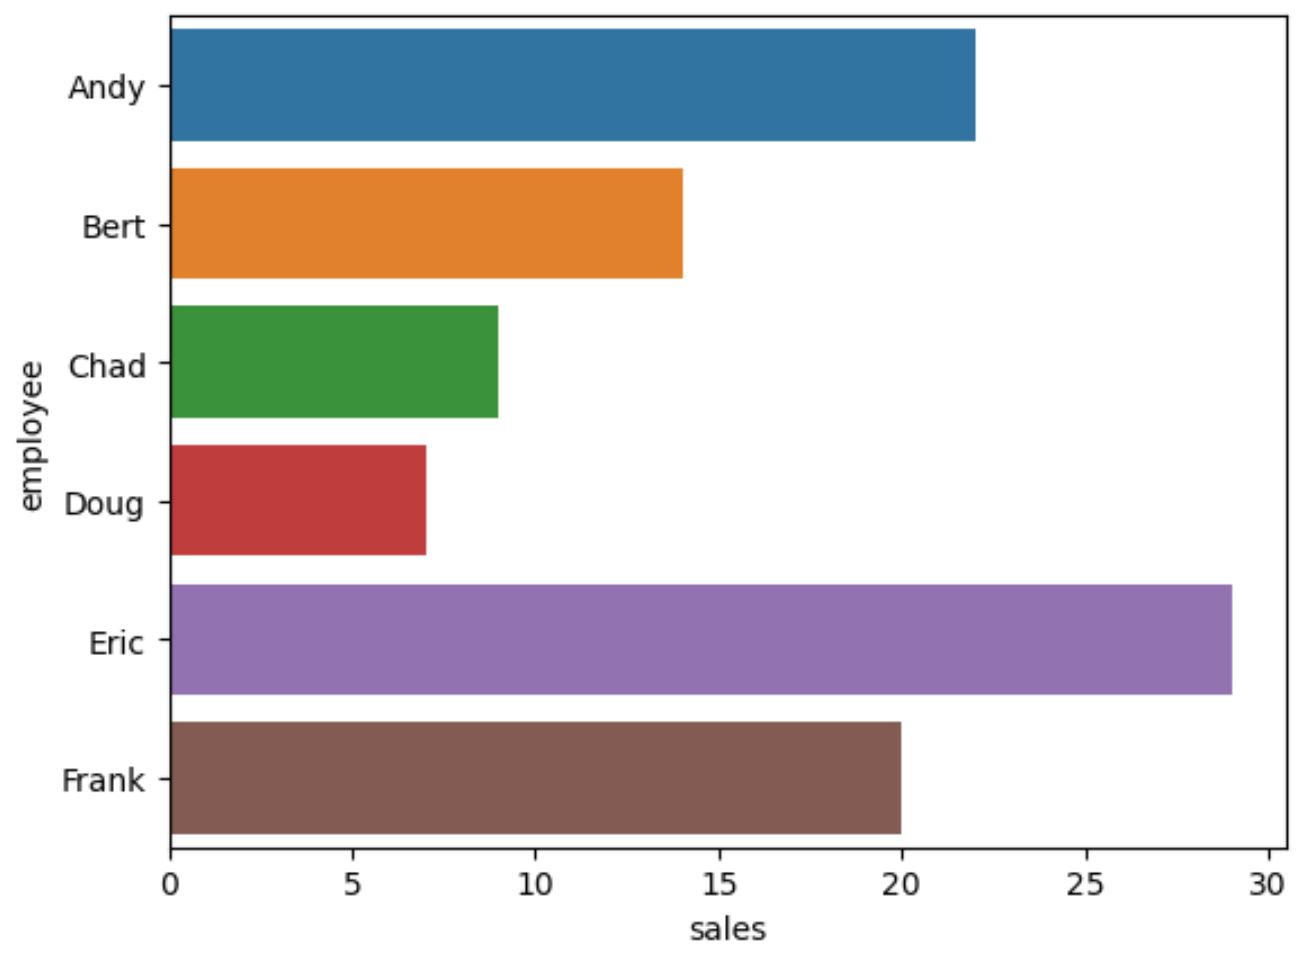
x-axis သည် ဝန်ထမ်းတစ်ဦးစီမှ ပြုလုပ်သော အရောင်းများကို ပြသပြီး y-axis သည် ဝန်ထမ်းများ၏ အမည်များကို ပြသသည်။
ဘားအရောင်များကို သတ်မှတ်နိုင်ပြီး ဝင်ရိုးအညွှန်းများဖြင့် စိတ်ကြိုက်ခေါင်းစဉ်တစ်ခုကိုလည်း ထည့်နိုင်သည်ကို သတိပြုပါ။
 import matplotlib. pyplot as plt
import seaborn as sns

#create horizontal bar chart
sns. barplot (x=df. sales , y=df. employee , color=' steelblue ', orient=' h ')

#add plot title
plt. title (' Total Sales by Employee ', fontsize= 16 )

#add axis labels
plt. xlabel (' Total Sales ')
plt. ylabel (' Employee Name ')
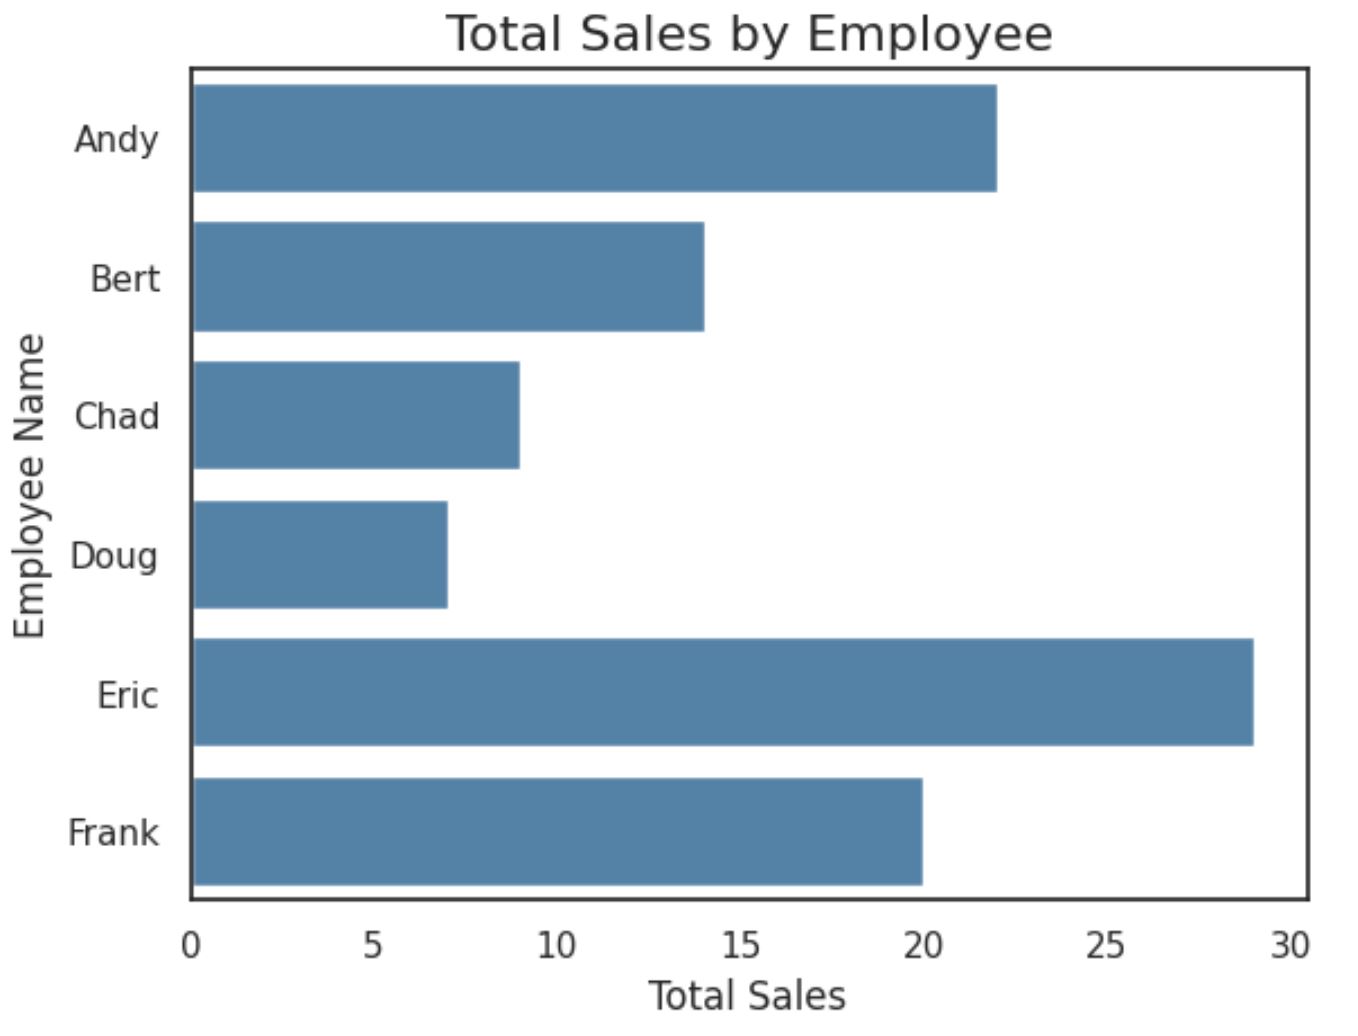
ယခုအခါ ကွက်ကွက်ဘားများသည် တစ်ခုစီတွင် တူညီသောအရောင်ရှိကြပြီး ဇာတ်လမ်းကိုဖတ်ရလွယ်ကူစေရန်အတွက် ကွက်ကွက်ခေါင်းစဉ်နှင့် ဝင်ရိုးအညွှန်းများကို ပေါင်းထည့်ထားပါသည်။
မှတ်ချက် – အကယ်၍ သင်သည် Jupyter မှတ်စုစာအုပ်သို့ seaborn တင်သွင်းရာတွင် အခက်အခဲရှိနေပါက၊ သင်သည် %pip install seaborn command ကို ဦးစွာလုပ်ဆောင်ရန် လိုအပ်ပါသည်။
ထပ်လောင်းအရင်းအမြစ်များ
အောက်ဖော်ပြပါ သင်ခန်းစာများသည် ပင်လယ်မွေးတွင် အခြားဘုံလုပ်ဆောင်ချက်များကို မည်သို့လုပ်ဆောင်ရမည်ကို ရှင်းပြသည်-
Seaborn Barplot တွင် တန်ဖိုးများပြသနည်း
Seaborn တွင် အုပ်စုဖွဲ့ barplot ဖန်တီးနည်း
Seaborn barplot တွင်ဘားများ၏အရောင်သတ်မှတ်နည်း
စာရေးသူအကြောင်း
Benjamin Anderson
မင်္ဂလာပါ၊ ကျွန်ုပ်သည် အငြိမ်းစား စာရင်းအင်း ပါမောက္ခ ဘင်ဂျမင်ဖြစ်ပြီး သီးသန့် Statorials ဆရာအဖြစ် လှည့်ပတ်ပါသည်။ စာရင်းဇယားနယ်ပယ်တွင် ကျယ်ပြန့်သောအတွေ့အကြုံနှင့် ကျွမ်းကျင်မှုနှင့်အတူ၊ Statorials မှတစ်ဆင့် ကျောင်းသားများကို ခွန်အားဖြစ်စေရန်အတွက် ကျွန်ုပ်၏အသိပညာကို မျှဝေလိုပါသည်။ ပိုသိတယ်။