Pandas dataframe မှ point cloud တစ်ခုကို ဖန်တီးနည်း
pandas DataFrame မှဒေတာကိုအသုံးပြုပြီး point cloud တစ်ခုကိုဖန်တီးရန်နည်းလမ်းနှစ်ခုရှိသည်။
1. pandas.DataFrame.plot.scatter ကိုသုံးပါ။
scatterplot ဖန်တီးရန် နည်းလမ်းတစ်ခုမှာ pandas built-in plot.scatter() လုပ်ဆောင်ချက်ကို အသုံးပြုရန်ဖြစ်သည်-
 import pandas as pd

df. plot . scatter (x = ' x_column_name ', y = ' y_columnn_name ')
2. matplotlib.pyplot.scatter ကိုသုံးပါ။
scatterplot ဖန်တီးရန် အခြားနည်းလမ်းမှာ Matplotlib pyplot.scatter() လုပ်ဆောင်ချက်ကို အသုံးပြုရန်ဖြစ်သည်။
 import matplotlib. pyplot as plt

plt. scatter (df.x, df.y)
ဤသင်ခန်းစာသည် ဤနည်းလမ်းတစ်ခုစီကို အသုံးပြုခြင်း၏ ဥပမာကို ပေးသည်။
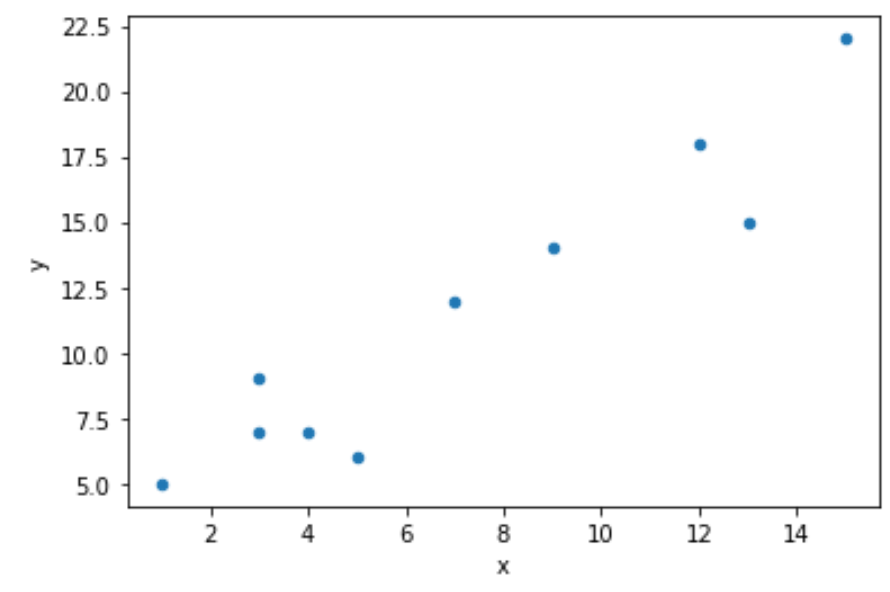
ဥပမာ 1- ပန်ဒါများကို အသုံးပြုခြင်း။
အောက်ပါကုဒ်သည် ရိုးရှင်းသော scatterplot ဖန်တီးရန် plot.scatter() လုပ်ဆောင်ချက်ကို အသုံးပြုပုံကို ပြသသည်-
 import pandas as pd

#createDataFrame
df = pd. DataFrame ({'x': [1, 3, 3, 4, 5, 7, 9, 12, 13, 15],
                   'y': [5, 7, 9, 7, 6, 12, 14, 18, 15, 22]})

#create scatterplot
df. plot . scatter (x=' x ', y=' y ')
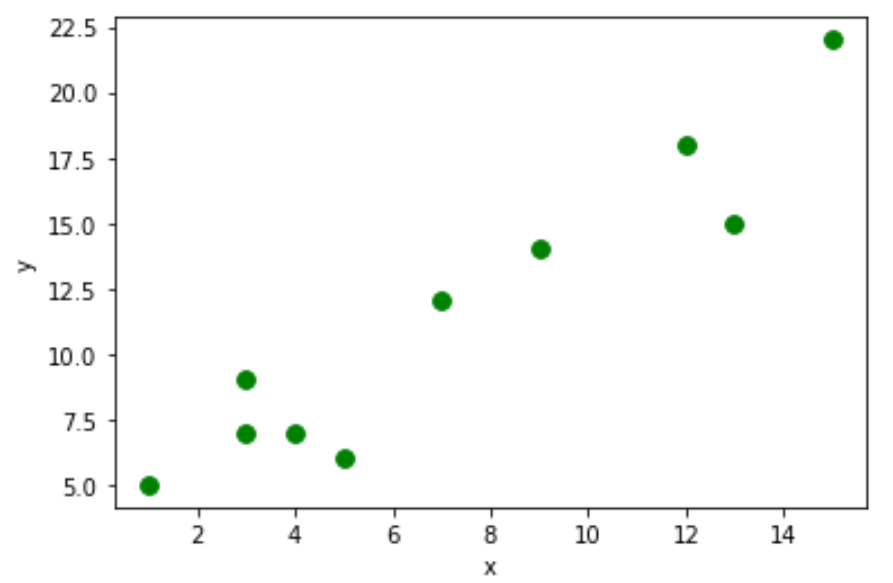
အမှတ်များ၏ အရွယ်အစားနှင့် အရောင်တို့ကို အသီးသီးပြောင်းလဲရန် s နှင့် c အငြင်းအခုံများကို အသုံးပြုနိုင်ကြောင်း သတိပြုပါ-
df. plot . scatter (x=' x ', y=' y ', s= 60 , c=' green ')
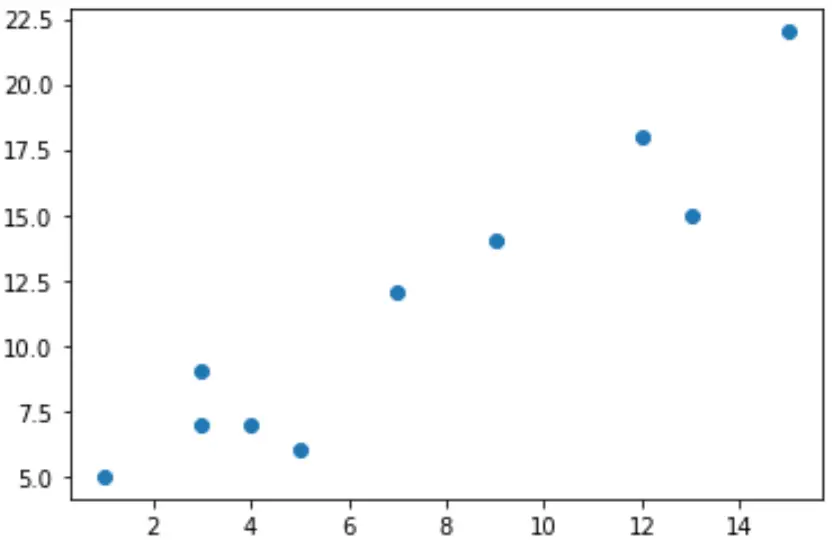
ဥပမာ 2- Matplotlib ကို အသုံးပြုခြင်း။
scatterplot ဖန်တီးရန်အတွက် အောက်ပါကုဒ်သည် pyplot.scatter() လုပ်ဆောင်ချက်ကို အသုံးပြုနည်းကို ပြသသည်-
 import pandas as pd
import matplotlib. pyplot as plt

#createDataFrame
df = pd. DataFrame ({'x': [1, 3, 3, 4, 5, 7, 9, 12, 13, 15],
                   'y': [5, 7, 9, 7, 6, 12, 14, 18, 15, 22]})

#create scatterplot
plt. scatter (df.x, df.y)
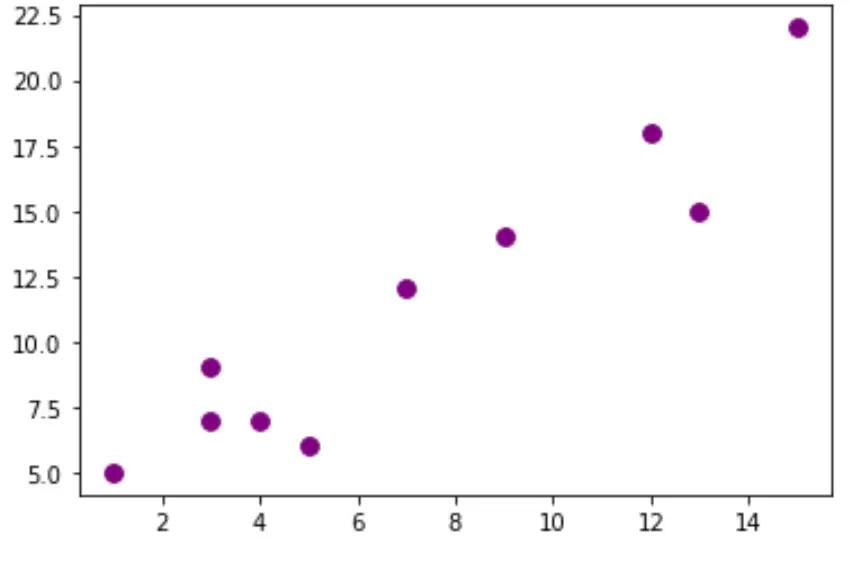
အမှတ်များ၏ အရွယ်အစားနှင့် အရောင်တို့ကို အသီးသီးပြောင်းလဲရန် s နှင့် c အငြင်းအခုံများကို အသုံးပြုနိုင်ကြောင်း သတိပြုပါ-
plt. scatter (df.x, df.y, s= 60 , c=' purple ')
နောက်ထပ် Python သင်ခန်းစာများကို ဤနေရာတွင် ရှာနိုင်သည်။
စာရေးသူအကြောင်း
Benjamin Anderson
မင်္ဂလာပါ၊ ကျွန်ုပ်သည် အငြိမ်းစား စာရင်းအင်း ပါမောက္ခ ဘင်ဂျမင်ဖြစ်ပြီး သီးသန့် Statorials ဆရာအဖြစ် လှည့်ပတ်ပါသည်။ စာရင်းဇယားနယ်ပယ်တွင် ကျယ်ပြန့်သောအတွေ့အကြုံနှင့် ကျွမ်းကျင်မှုနှင့်အတူ၊ Statorials မှတစ်ဆင့် ကျောင်းသားများကို ခွန်အားဖြစ်စေရန်အတွက် ကျွန်ုပ်၏အသိပညာကို မျှဝေလိုပါသည်။ ပိုသိတယ်။