Pandas- ဘားကွက်တစ်ခုတွင် ဘားများကို မှတ်သားနည်း
ပန်ဒါဘားကွက်ကွက်တွင် ဘားများကို မှတ်သားရန် အောက်ပါနည်းလမ်းများကို အသုံးပြုနိုင်သည်။
နည်းလမ်း 1- ရိုးရှင်းသော ဘားကွက်ကွက်တွင် ဘားများကို မှတ်သားပါ။
 ax = df. plot . bar ()

ax. bar_label ( ax.containers [ 0 ])
နည်းလမ်း 2- အုပ်စုဖွဲ့ထားသော ဘားကွက်ကွက်တွင် ဘားများကို မှတ်သားပါ။
 ax = df. plot . bar ()

for container in ax. containers :
    ax. bar_label (container)
အောက်ဖော်ပြပါ ဥပမာများသည် နည်းလမ်းတစ်ခုစီကို လက်တွေ့အသုံးချနည်းကို ပြသထားသည်။
ဥပမာ 1- ရိုးရှင်းသော ဘားကွက်ကွက်တွင် ဘားများကို မှတ်သားပါ။
အောက်ဖော်ပြပါ ကုဒ်သည် ရိုးရှင်းသော ဘားကွက်ကွက်တွင် ဘားများကို မှတ်ချက်ရေးနည်းကို ပြသသည်-
 import pandas as pd

#createDataFrame
df = pd. DataFrame ({' product ': ['A', 'B', 'C', 'D', 'E'],
                   ' sales ': [4, 7, 8, 15, 12]})

#view DataFrame
print (df)

  product sales
0 to 4
1 B 7
2 C 8
3 D 15
4 E 12

#create bar plot to visualize sales by product
ax = df. plot . bar (x=' product ', y=' sales ', legend= False )

#annotate bars
ax. bar_label ( ax.containers [ 0 ])
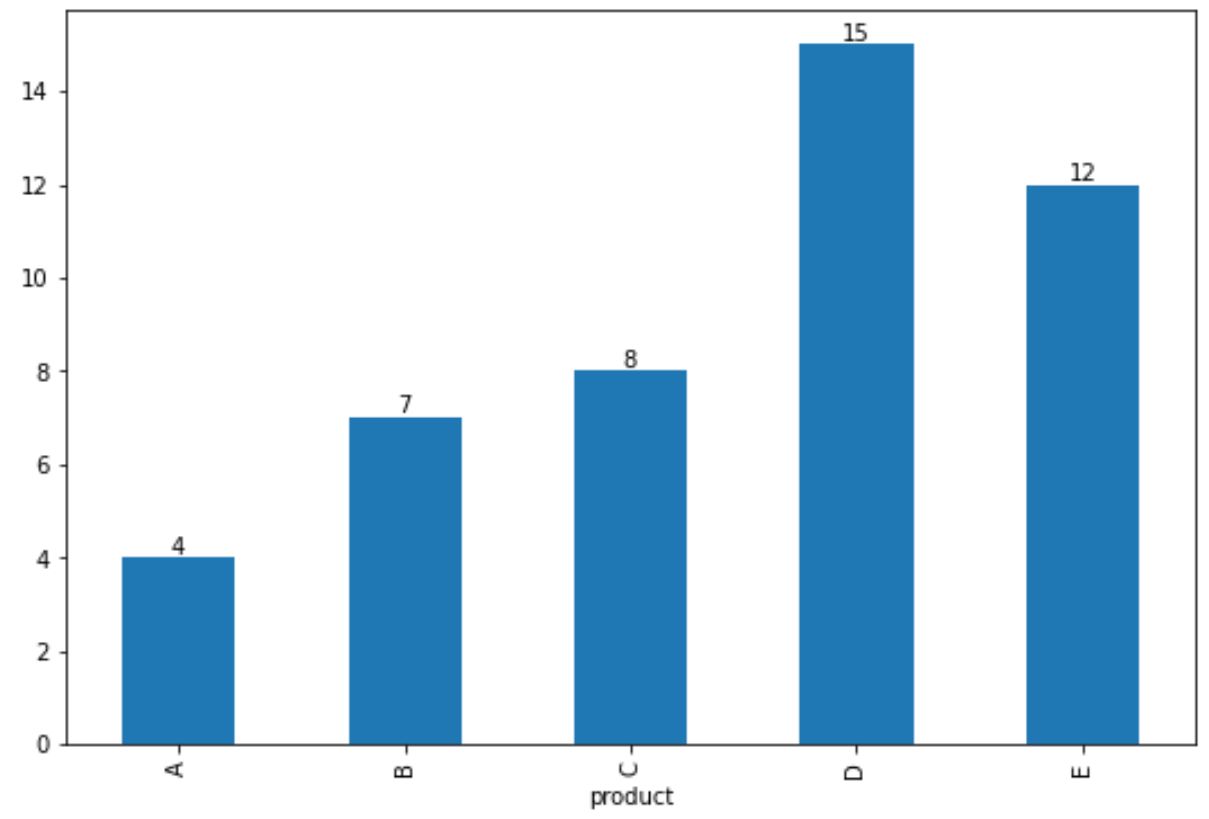
ဘားတစ်ခုစီ၏ထိပ်တွင် အမှန်တကယ်ရောင်းချမှုတန်ဖိုးကို ပြသထားကြောင်း သတိပြုပါ။
ဥပမာ 2- အုပ်စုဖွဲ့ထားသော ဘားကွက်ကွက်တွင် ဘားများကို မှတ်သားပါ။
အောက်ဖော်ပြပါ ကုဒ်သည် အုပ်စုဖွဲ့ထားသော ဘားကွက်တစ်ခုတွင် ဘားများကို မှတ်စုပုံသွင်းနည်းကို ပြသည်-
 #createDataFrame
df = pd. DataFrame ({' productA ': [14, 10],
                   ' productB ': [17, 19]},
                    index=['store 1', 'store 2'])

#view DataFrame
print (df)

         productA productB
store 1 14 17
store 2 10 19

#create grouped bar plot
ax = df. plot . bar ()

#annotate bars in bar plot
for container in ax. containers :
    ax. bar_label (container)
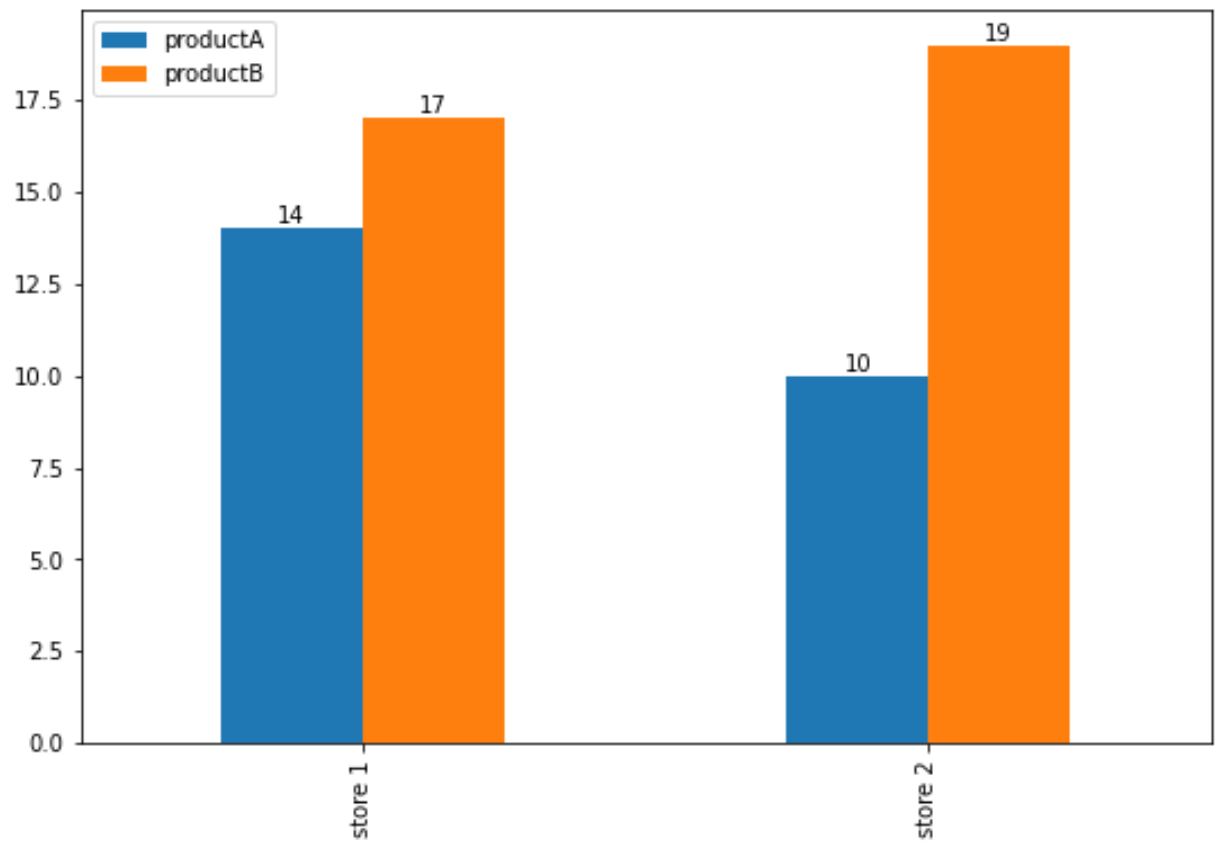
ကွက်ကွက်ရှိ မှတ်ချက်များကို တစ်ခုချင်းစီဘားတစ်ခုစီတွင် ထည့်သွင်းထားကြောင်း သတိပြုပါ။
ထပ်လောင်းအရင်းအမြစ်များ
အောက်ဖော်ပြပါ သင်ခန်းစာများသည် ပန်ဒါများတွင် အခြားသော ဘုံအမြင်အာရုံများကို ဖန်တီးနည်းကို ရှင်းပြသည်-
Pandas DataFrame မှ boxplot တစ်ခုဖန်တီးနည်း
Pandas DataFrame မှ Pie Chart ဖန်တီးနည်း
Pandas DataFrame မှ histogram တစ်ခုဖန်တီးနည်း
စာရေးသူအကြောင်း
Benjamin Anderson
မင်္ဂလာပါ၊ ကျွန်ုပ်သည် အငြိမ်းစား စာရင်းအင်း ပါမောက္ခ ဘင်ဂျမင်ဖြစ်ပြီး သီးသန့် Statorials ဆရာအဖြစ် လှည့်ပတ်ပါသည်။ စာရင်းဇယားနယ်ပယ်တွင် ကျယ်ပြန့်သောအတွေ့အကြုံနှင့် ကျွမ်းကျင်မှုနှင့်အတူ၊ Statorials မှတစ်ဆင့် ကျောင်းသားများကို ခွန်အားဖြစ်စေရန်အတွက် ကျွန်ုပ်၏အသိပညာကို မျှဝေလိုပါသည်။ ပိုသိတယ်။