Pandas- များစွာသော dataframes များကို အပိုင်းခွဲများတွင် မည်သို့ဆွဲမည်နည်း။
အပိုင်းခွဲများအတွင်း ပန်ဒါ DataFrames များစွာကို ချရန် အောက်ပါ အခြေခံ အထားအသိုကို အသုံးပြုနိုင်သည်။
 import matplotlib. pyplot as plt

#define subplot layout
fig, axes = plt. subplots (nrows= 2 , ncols= 2 )

#add DataFrames to subplots
df1. plot (ax=axes[0,0])
df2. plot (ax=axes[0,1])
df3. plot (ax=axes[1,0])
df4. plot (ax=axes[1,1])
အောက်ဖော်ပြပါ ဥပမာသည် ဤ syntax ကို လက်တွေ့တွင် မည်သို့အသုံးပြုရမည်ကို ပြသထားသည်။
ဥပမာ- အပိုင်းခွဲများတွင် Pandas DataFrames များစွာကို ရေးဆွဲခြင်း။
ကျွန်ုပ်တို့တွင် မတူညီသော လက်လီစတိုးဆိုင်လေးခုတွင် ရောင်းချမှုနှင့် ပြန်ရငွေဆိုင်ရာ အချက်အလက်များပါရှိသော ပန်ဒါ DataFrames လေးခုရှိသည် ဆိုကြပါစို့။
 import pandas as pd

#create four DataFrames
df1 = pd. DataFrame ({' sales ': [2, 5, 5, 7, 9, 13, 15, 17, 22, 24],
                    ' returns ': [1, 2, 3, 4, 5, 6, 7, 8, 7, 5]})

df2 = pd. DataFrame ({' sales ': [2, 5, 11, 18, 15, 15, 14, 9, 6, 7],
                    ' returns ': [1, 2, 0, 2, 2, 4, 5, 4, 2, 1]})

df3 = pd. DataFrame ({' sales ': [6, 8, 8, 7, 8, 9, 10, 7, 8, 12],
                    ' returns ': [1,0, 1, 1, 1, 2, 3, 2, 1, 3]})

df4 = pd. DataFrame ({' sales ': [10, 7, 7, 6, 7, 6, 4, 3, 3, 2],
                    ' returns ': [4, 4, 3, 3, 2, 3, 2, 1, 1, 0]})
အတန်း 2 တန်းနှင့် ကော်လံ 2 ခုပါသော layout တစ်ခုပါရှိသော ဤ DataFrames တစ်ခုစီကို အပိုင်းခွဲတစ်ခုစီတွင် ချရန် အောက်ပါ syntax ကို အသုံးပြုနိုင်ပါသည်။
 import matplotlib. pyplot as plt

#define subplot layout
fig, axes = plt. subplots (nrows= 2 , ncols= 2 )

#add DataFrames to subplots
df1. plot (ax=axes[0,0])
df2. plot (ax=axes[0,1])
df3. plot (ax=axes[1,0])
df4. plot (ax=axes[1,1])

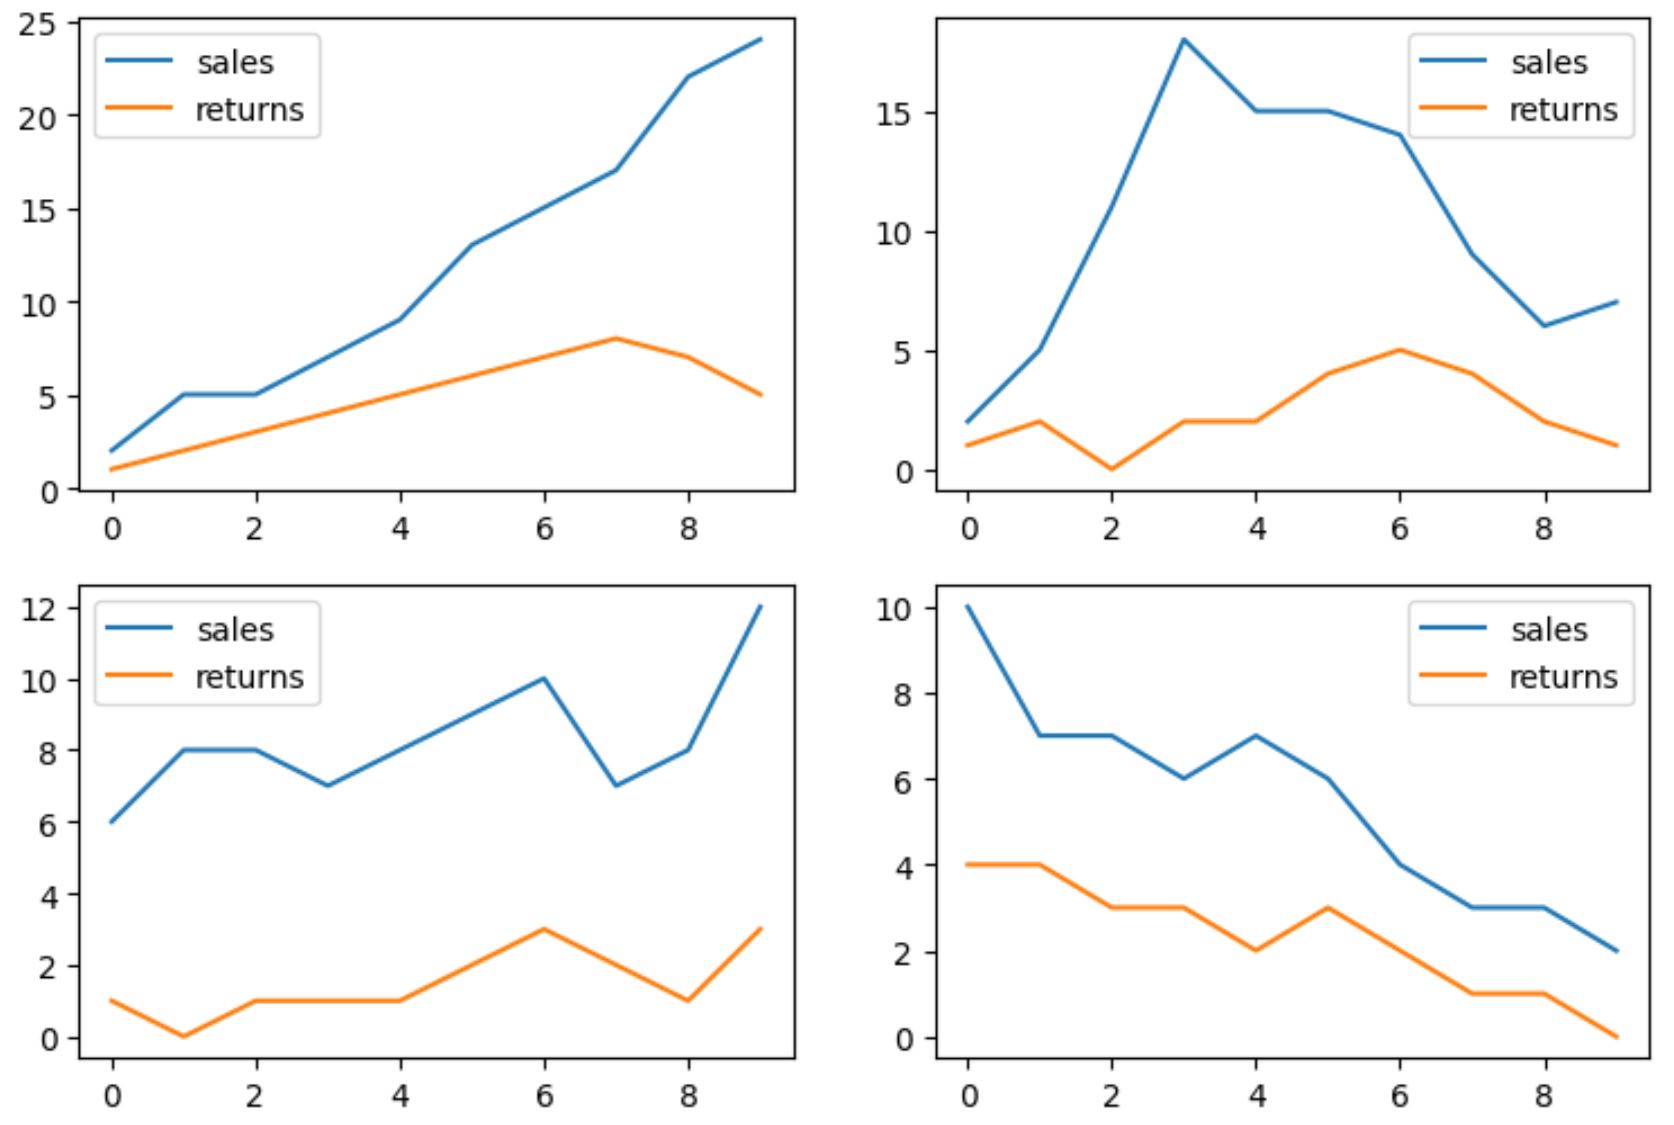
DataFrames လေးခုမှ တစ်ခုစီကို အပိုင်းခွဲတစ်ခုတွင် ပြသထားသည်။
DataFrame တစ်ခုစီကို မည်သည့်နေရာတွင် ထားရှိသင့်သည်ကို သတ်မှတ်ရန် axes argument ကို အသုံးပြုခဲ့ကြောင်း သတိပြုပါ။
ဥပမာအားဖြင့်၊ df1 ဟုခေါ်သော DataFrame ကို အတန်းအညွှန်းတန်ဖိုး 0 နှင့် ကော်လံအညွှန်းတန်ဖိုး 0 (ဥပမာ- ဘယ်ဘက်အပေါ်ထောင့်ရှိ အပိုင်းခွဲ) ဖြင့် နေရာချထားပါသည်။
nrows နှင့် ncols arguments များကို အသုံးပြု၍ subplots များ၏ layout ကို ပြောင်းလဲနိုင်သည်ကို သတိပြုပါ။
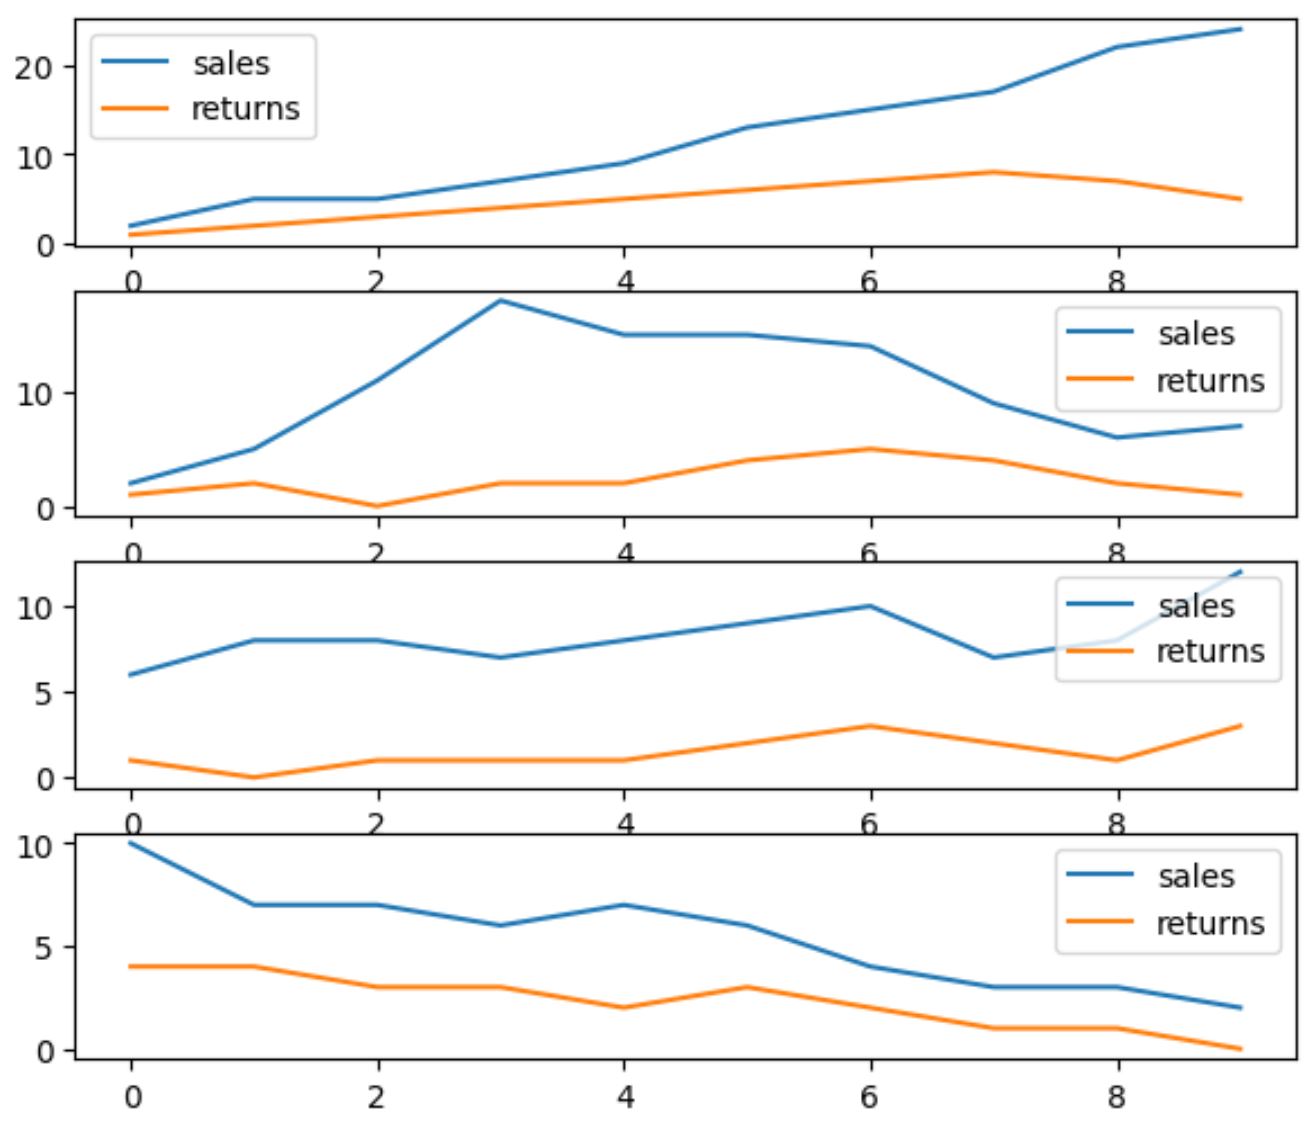
ဥပမာအားဖြင့်၊ အောက်ပါကုဒ်သည် အပိုင်းခွဲများကို အတန်းလေးတန်းနှင့် ကော်လံတစ်ခုအဖြစ် မည်သို့စုစည်းရမည်ကို ပြသသည်-
 import matplotlib. pyplot as plt

#define subplot layout
fig, axes = plt. subplots (nrows= 4 , ncols= 1 )

#add DataFrames to subplots
df1. plot (ax=axes[0])
df2. plot (ax=axes[1])
df3. plot (ax=axes[2])
df4. plot (ax=axes[3])

အပိုင်းခွဲများကို ယခု အတန်းလေးခုနှင့် ကော်လံတစ်ခုပါရှိသော အပြင်အဆင်တွင် စီစဉ်ထားပါသည်။
အပိုင်းခွဲများကို y နှင့် x axes တွင် တူညီသောစကေးများ ရှိစေလိုပါက၊ sharey နှင့် sharex အကြောင်းပြချက်များကို အသုံးပြုနိုင်သည်။
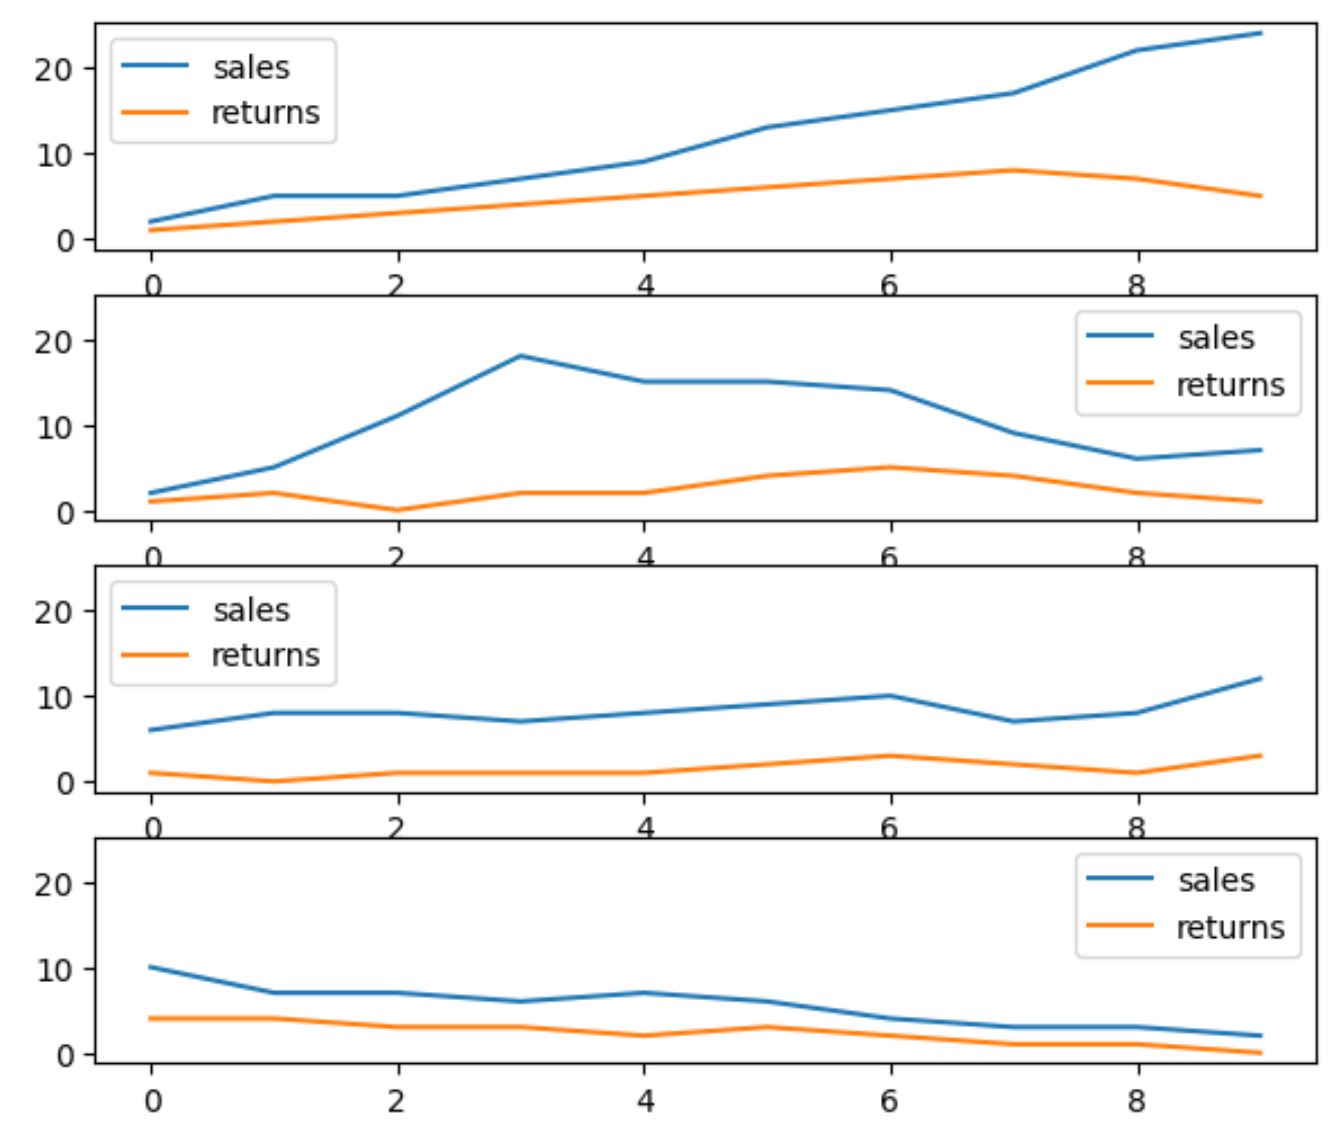
ဥပမာအားဖြင့်၊ အောက်ဖော်ပြပါ ကုဒ်သည် အပိုင်းခွဲများအားလုံးကို Y ဝင်ရိုးပေါ်တွင် တူညီသောစကေးရှိစေရန် မျှဝေထားသော အငြင်းအခုံကို မည်သို့အသုံးပြုရမည်ကို ပြသသည်-
 import matplotlib. pyplot as plt

#define subplot layout, force subplots to have same y-axis scale
fig, axes = plt. subplots (nrows= 4 , ncols= 1 , sharey= True )

#add DataFrames to subplots
df1. plot (ax=axes[0])
df2. plot (ax=axes[1])
df3. plot (ax=axes[2])
df4. plot (ax=axes[3])

အပိုင်းခွဲတစ်ခုစီ၏ Y ဝင်ရိုးသည် ယခု 0 မှ 20 အထိရှိနေသည်ကို သတိပြုပါ။
ထပ်လောင်းအရင်းအမြစ်များ
အောက်ဖော်ပြပါ သင်ခန်းစာများသည် ပန်ဒါများတွင် အခြားဘုံလုပ်ဆောင်ချက်များကို မည်သို့လုပ်ဆောင်ရမည်ကို ရှင်းပြသည်-
Pandas DataFrame မှ Pie Chart ဖန်တီးနည်း
Pandas DataFrame မှ point cloud တစ်ခုကို ဖန်တီးနည်း
Pandas DataFrame မှ histogram တစ်ခုဖန်တီးနည်း