Ggplot2 တွင် ဘေးချင်းကပ်ကွက်များ ဖန်တီးနည်း
မကြာခဏဆိုသလို၊ သင်သည် R တွင် ggplot2 ပက်ကေ့ဂျ်ကို အသုံးပြု၍ ကွက်ကွက်နှစ်ခုကို ဖန်တီးလိုပေမည်။ ကံကောင်းထောက်မစွာ၊ ၎င်းသည် patchwork package ၏အကူအညီဖြင့် လုပ်ဆောင်ရန်လွယ်ကူသည်။
 #install ggplot2 and patchwork packages
install.packages(' ggplot2 ')
install.packages(' patchwork ')

#load the packages
library(ggplot2)
library(patchwork)
ဤသင်ခန်းစာတွင် ဘေးချင်းကပ်ကွက်များကို ဖန်တီးရန် ဤပက်ကေ့ဂျ်များကို အသုံးပြုခြင်း၏ နမူနာများစွာကို ပြသထားသည်။
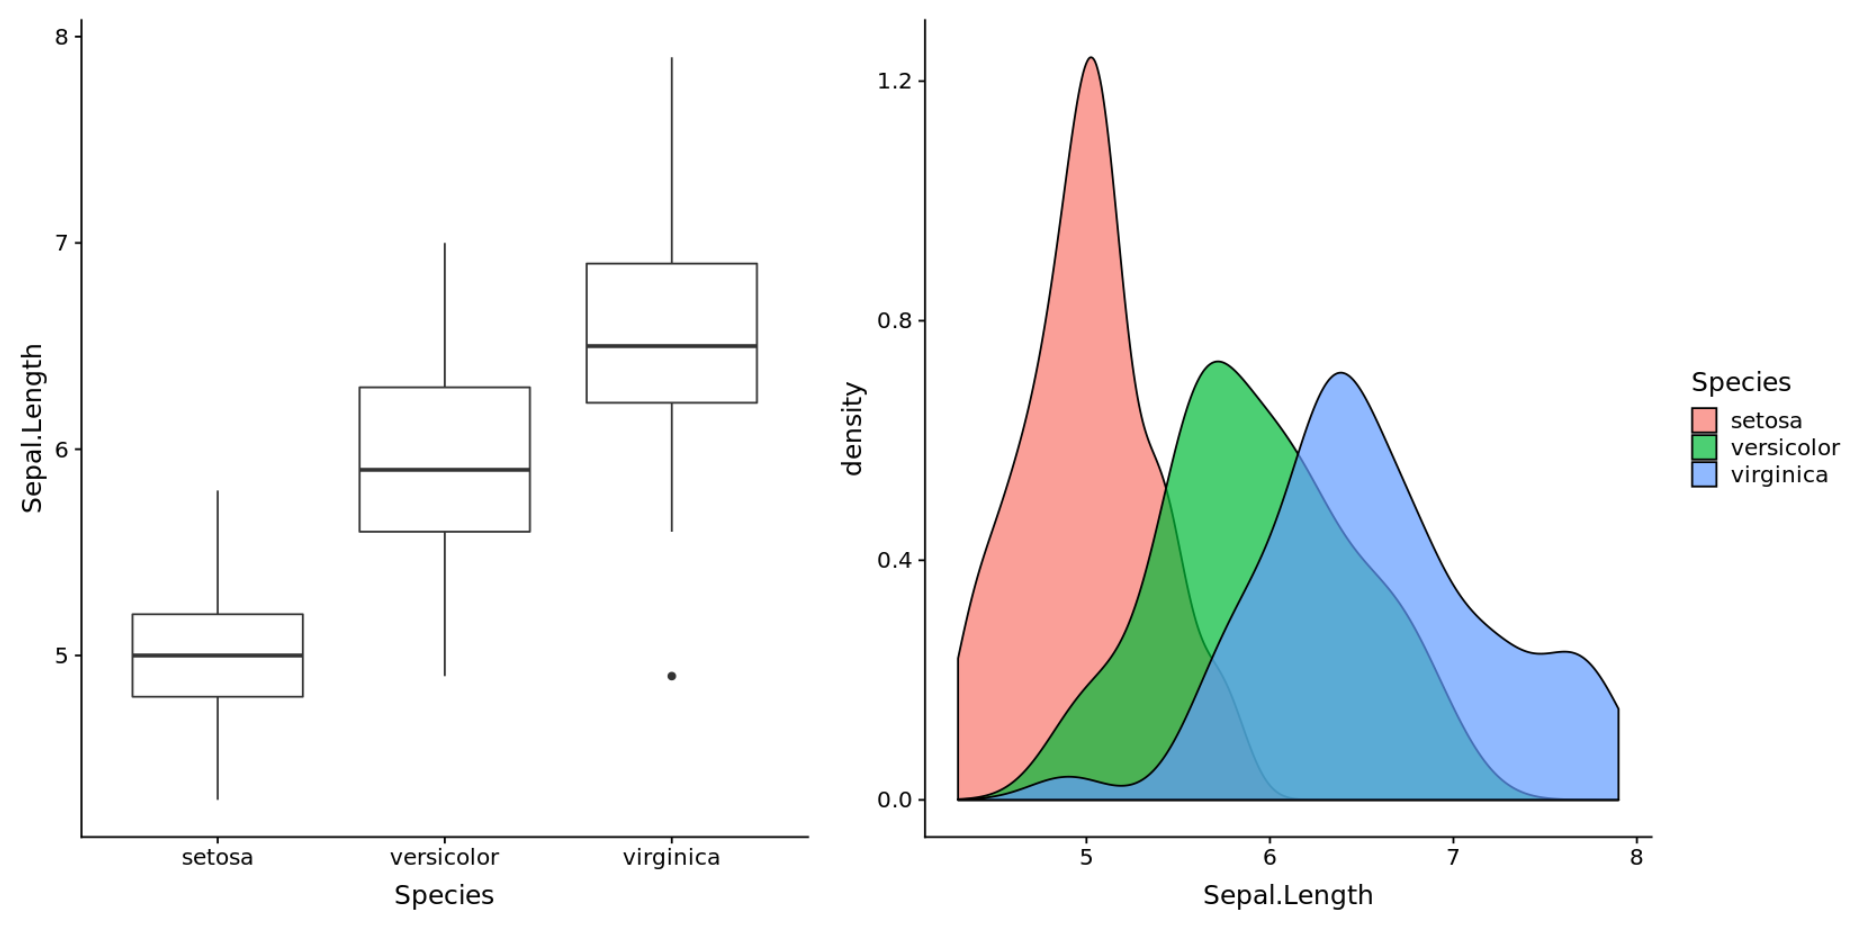
ဥပမာ 1- ဘေးချင်းကပ် နှစ်ကွက်
R’s built-in iris dataset ကိုအသုံးပြုပြီး ဘေးချင်းကပ်ကွက်နှစ်ခု ဖန်တီးနည်းကို အောက်ပါကုဒ်က ပြသည်-
 #create box plot
plot1 <- ggplot(iris, aes(x = Species, y = Sepal.Length)) +
  geom_boxplot()

#create density plot
plot2 <- ggplot(iris, aes(x = Sepal.Length, fill = Species)) +
  geom_density(alpha = 0.8)

#display plots side by side
plot1 + plot2
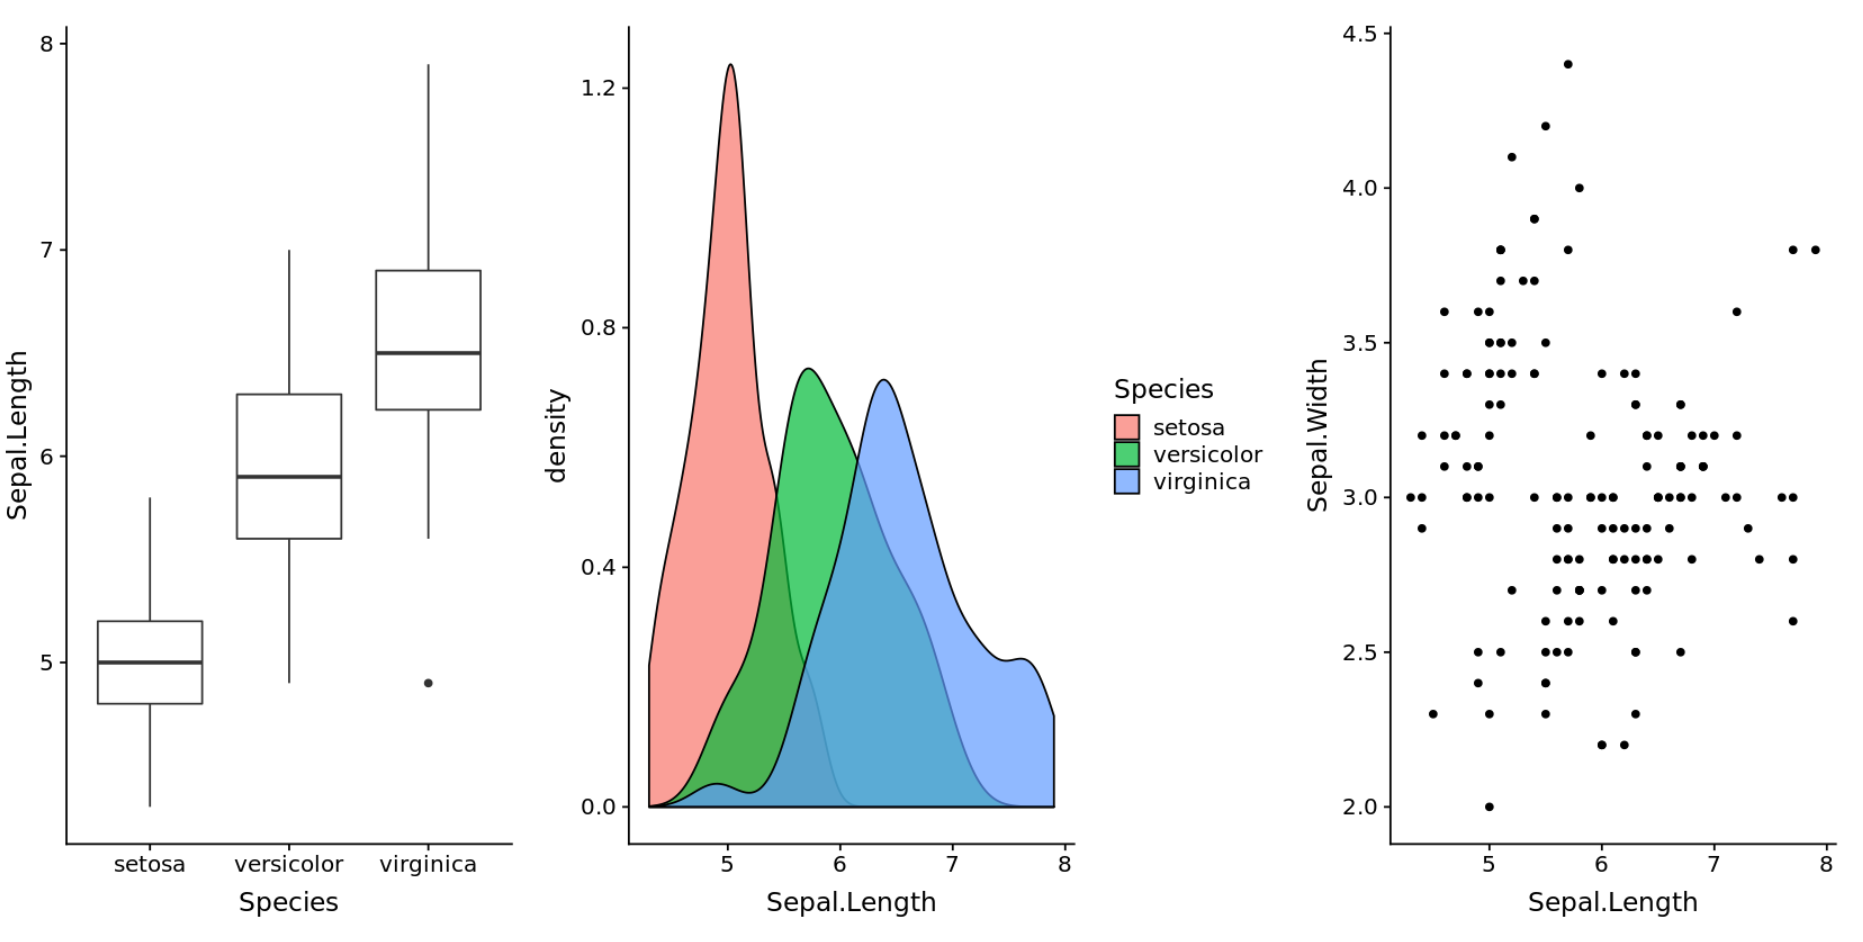
ဥပမာ 2- ဘေးချင်းကပ်သုံးကွက်
R’s built-in iris dataset ကို အသုံးပြု၍ ဘေးချင်းကပ်ကွက် သုံးခုဖန်တီးနည်းကို အောက်ပါကုဒ်တွင် ပြသည်-
 #create box plot
plot1 <- ggplot(iris, aes(x = Species, y = Sepal.Length)) +
  geom_boxplot()

#create density plot
plot2 <- ggplot(iris, aes(x = Sepal.Length, fill = Species)) +
  geom_density(alpha = 0.7)

#create scatterplot
plot3 <- ggplot(iris, aes(x = Sepal.Length, y = Sepal.Width)) +
  geom_point()

#display three plots side by side
plot1 + plot2 + plot3
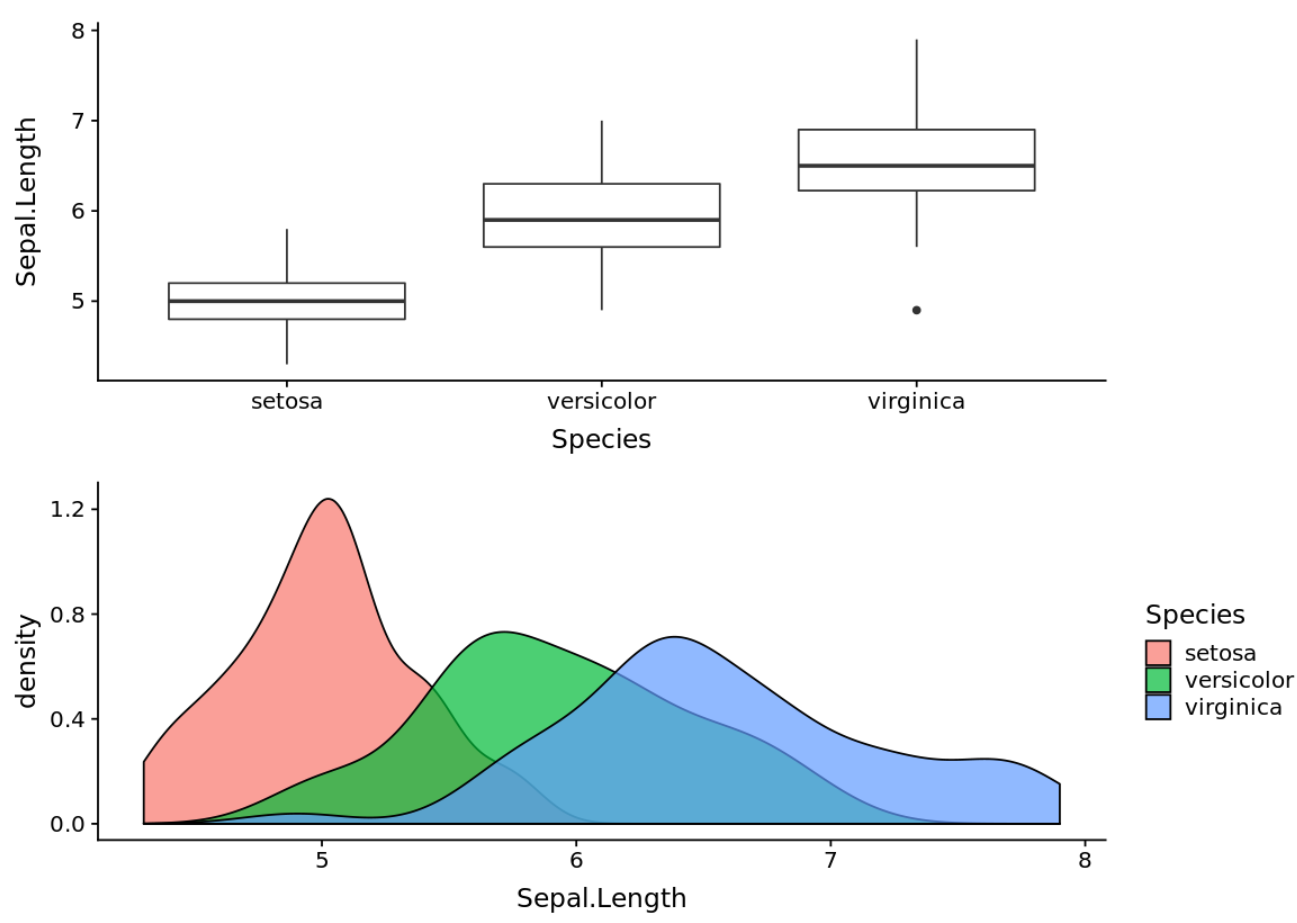
ဥပမာ 3- နှစ်ထပ်ကွက်များ
အောက်ဖော်ပြပါ ကုဒ်သည် အစီအစဥ်နှစ်ခုကို ဖန်တီးနည်းကို ပြသည်၊ အခြားတစ်ခု၏အပေါ်တွင်၊
 #create box plot
plot1 <- ggplot(iris, aes(x = Species, y = Sepal.Length)) +
  geom_boxplot()

#create density plot
plot2 <- ggplot(iris, aes(x = Sepal.Length, fill = Species)) +
  geom_density(alpha = 0.7)

#display plots stacked on top of each other
plot1 / plot2
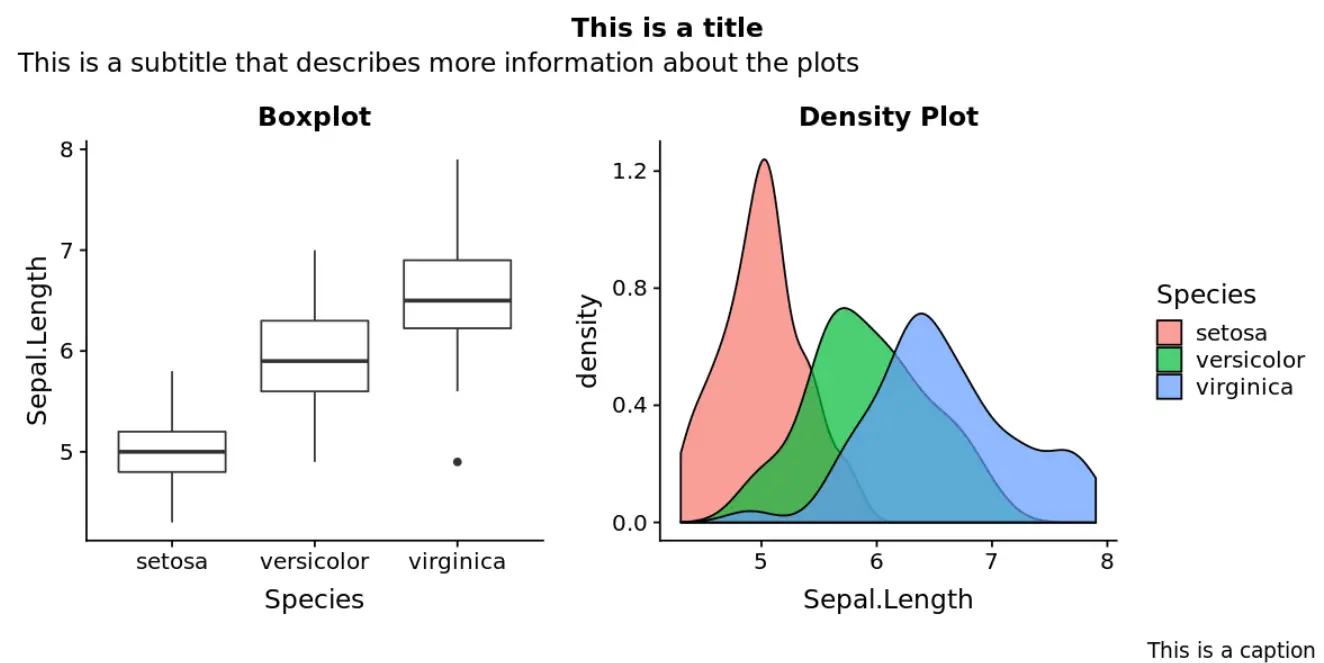
ဥပမာ 4- ခေါင်းစဉ်များ၊ စာတန်းများနှင့် စာတန်းများကို ထည့်ပါ။
အောက်ဖော်ပြပါ ကုဒ်သည် ကွက်များသို့ ခေါင်းစဉ်များ၊ စာတန်းများနှင့် စာတန်းများ ထည့်သွင်းနည်းကို ပြသသည်-
 #create box plot
plot1 <- ggplot(iris, aes(x = Species, y = Sepal.Length)) +
  geom_boxplot() +
  ggtitle('Boxplot')

#create density plot
plot2 <- ggplot(iris, aes(x = Sepal.Length, fill = Species)) +
  geom_density(alpha = 0.7) +
  ggtitle('Density Plot')

#display plots side by side with title, subtitle, and captions
patchwork <- plot1 + plot2

patchwork + plot_annotation(
  title = ' This is a title ',
  subtitle = ' This is a subtitle that describes more information about the plots ',
  caption = ' This is a caption '
)
နောက်ထပ် R သင်ခန်းစာများကို ဤနေရာတွင် ရှာနိုင်သည်။
စာရေးသူအကြောင်း
Benjamin Anderson
မင်္ဂလာပါ၊ ကျွန်ုပ်သည် အငြိမ်းစား စာရင်းအင်း ပါမောက္ခ ဘင်ဂျမင်ဖြစ်ပြီး သီးသန့် Statorials ဆရာအဖြစ် လှည့်ပတ်ပါသည်။ စာရင်းဇယားနယ်ပယ်တွင် ကျယ်ပြန့်သောအတွေ့အကြုံနှင့် ကျွမ်းကျင်မှုနှင့်အတူ၊ Statorials မှတစ်ဆင့် ကျောင်းသားများကို ခွန်အားဖြစ်စေရန်အတွက် ကျွန်ုပ်၏အသိပညာကို မျှဝေလိုပါသည်။ ပိုသိတယ်။