Ggplot2 တွင် လော့ဂရစ်သမ်စကေးတစ်ခုကို ဖန်တီးနည်း
မကြာခဏဆိုသလို သင်သည် ggplot2 ကြံစည်မှု၏ x-ဝင်ရိုး သို့မဟုတ် y-ဝင်ရိုး၏စကေးကို လော့ဂရစ်သမ်စကေးအဖြစ်သို့ ပြောင်းလဲလိုပေမည်။
ggplot2 ကိုသာအသုံးပြု၍ ၎င်းကိုလုပ်ဆောင်ရန် နည်းလမ်းနှစ်ခုအနက်မှ တစ်ခုကို သင်အသုံးပြုနိုင်သည်-
1. scale_y_continuous() သို့မဟုတ် scale_x_continuous() ကိုသုံးပါ
 ggplot(df, aes (x=x, y=y)) +
  geom_point() +
  scale_y_continuous(trans=' log10 ') +
  scale_x_continuous(trans=' log10 ')
2. coordinate_trans() ကိုသုံးပါ
 ggplot(df, aes (x=x, y=y)) +
  geom_point() +
  coord_trans(y = ' log10 ' , x=' log10 ')
ထပ်ကိန်းများကိုပြသရန် ဝင်ရိုးအညွှန်းများကို ဖော်မတ်လုပ်လိုပါက၊ စကေး ပက်ကေ့ချ်ရှိ လုပ်ဆောင်ချက်များကို သင်အသုံးပြုနိုင်သည်-
 ggplot(df, aes (x=x, y=y)) +
  geom_point() +
  scale_y_continuous(trans=' log10 ',
                     breaks= trans_breaks (' log10 ', function (x) 10^x),
                     labels= trans_format (' log10 ', math_format (10^.x)))
ဤသင်ခန်းစာတွင် ဤလုပ်ဆောင်ချက်များကို လက်တွေ့အသုံးချနည်းနမူနာများကို ပြသထားသည်။
ဥပမာ 1- scale_y_continuous() ကို အသုံးပြု၍ လော့ဂရစ်သမ်စကေး
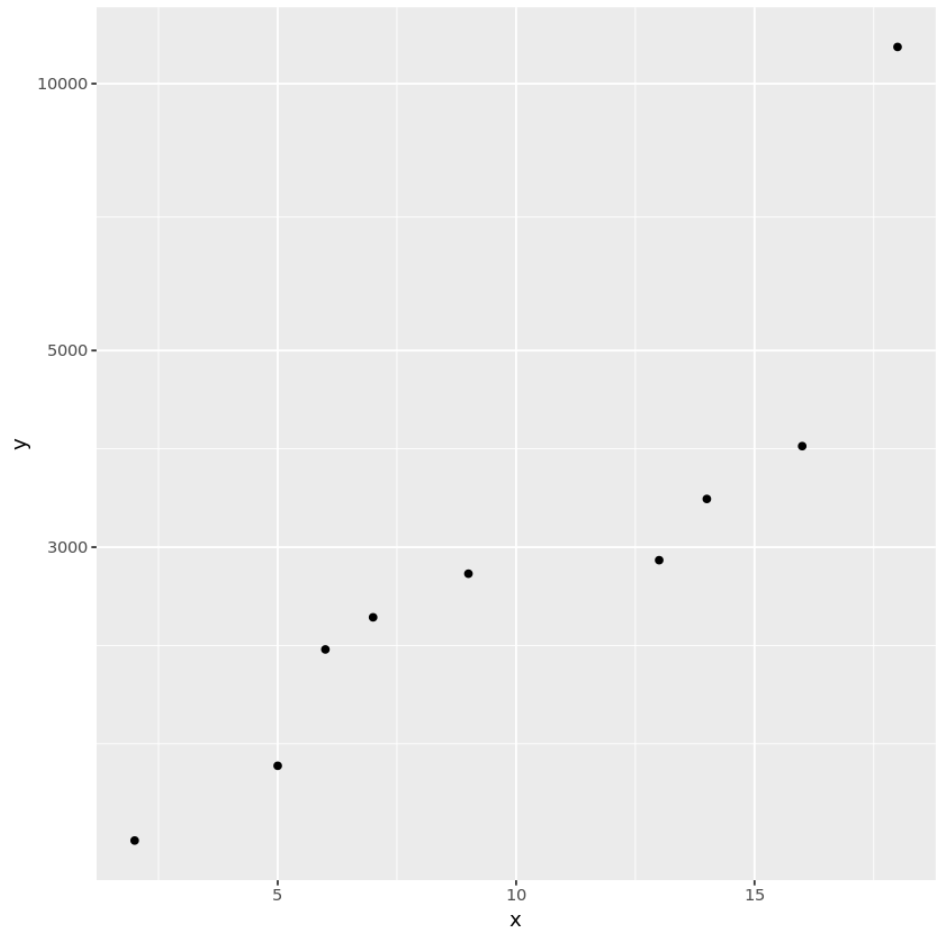
အောက်ပါကုဒ်သည် ခွဲခြမ်းစိတ်ဖြာသည့်ကွက်တစ်ခု၏ y ဝင်ရိုးအတွက် လော့ဂရစ်သမ်စကေးတစ်ခုဖန်တီးရန် scale_y_continuous() လုပ်ဆောင်ချက်ကို အသုံးပြုပုံကို ပြသသည်-
 library (ggplot2)

#create data frame
df <- data.frame(x=c(2, 5, 6, 7, 9, 13, 14, 16, 18),
                 y=c(1400, 1700, 2300, 2500, 2800, 2900, 3400, 3900, 11000))

#create scatterplot with log scale on y-axis
ggplot(df, aes (x=x, y=y)) +
  geom_point() +
  scale_y_continuous(trans=' log10 ')
ဥပမာ 2- coord_trans() ကို အသုံးပြု၍ လော့ဂရစ်သမ်စကေး
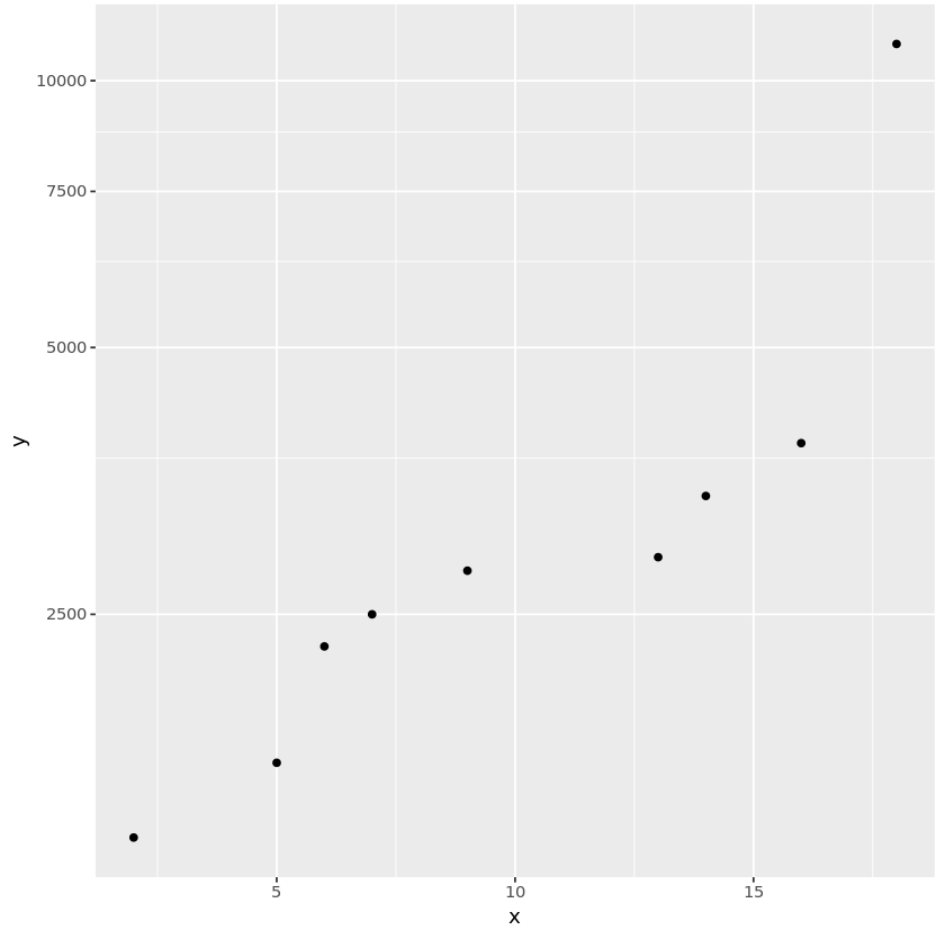
အောက်ဖော်ပြပါ ကုဒ်သည် ကွဲအက်ကွက်တစ်ခု၏ y-ဝင်ရိုးအတွက် လော့ဂရစ်သမ်စကေးတစ်ခုဖန်တီးရန် coord_trans() လုပ်ဆောင်ချက်ကို မည်သို့အသုံးပြုရမည်ကို ပြသသည်-
 library (ggplot2)

#create data frame
df <- data.frame(x=c(2, 5, 6, 7, 9, 13, 14, 16, 18),
                 y=c(1400, 1700, 2300, 2500, 2800, 2900, 3400, 3900, 11000))

#create scatterplot with log scale on y-axis
ggplot(df, aes (x=x, y=y)) +
  geom_point() +
  coord_trans(y=' log10 ')
ဥပမာ 3- စိတ်ကြိုက် လော့ဂရစ်သမ်စကေး အညွှန်းများ
အောက်ပါကုဒ်သည် ခွဲခြမ်းစိတ်ဖြာမှုတစ်ခု၏ y-ဝင်ရိုးအတွက် လော့ဂရစ်သမ်စကေးတစ်ခုကို ဖန်တီးရန်နှင့် စိတ်ကြိုက်အညွှန်းများနှင့်အတူ ထပ်ကိန်းများထည့်ရန် အောက်ပါကုဒ်သည် အတိုင်းအတာအထုပ် အတွင်း လုပ်ဆောင်ချက်များကို မည်သို့အသုံးပြုရမည်ကို ပြသသည်-
 library (ggplot2)
library (scales)

#create data frame
df <- data.frame(x=c(2, 5, 6, 7, 9, 13, 14, 16, 18),
                 y=c(1400, 1700, 2300, 2500, 2800, 2900, 3400, 3900, 11000))

#create scatterplot with log scale on y-axis and custom labels
ggplot(df, aes (x=x, y=y)) +
  geom_point() +
  scale_y_continuous(trans=' log10 ',
                     breaks= trans_breaks (' log10 ', function (x) 10^x),
                     labels= trans_format (' log10 ', math_format (10^.x)))
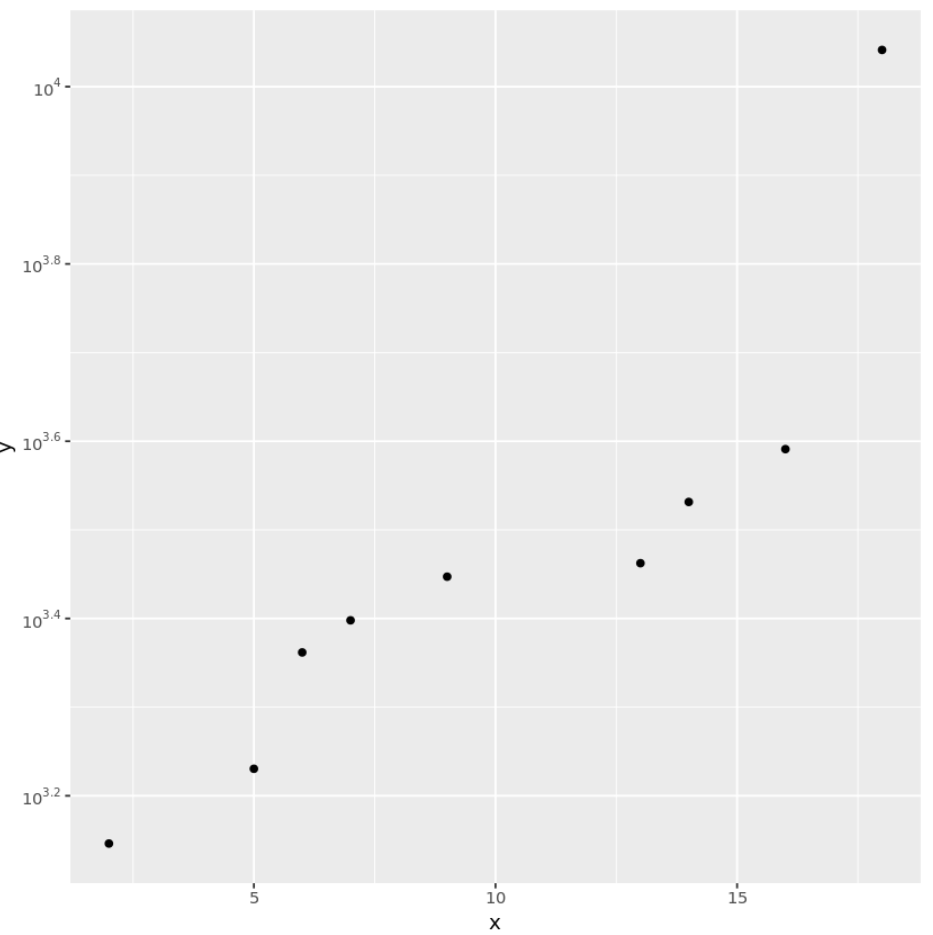
Y ဝင်ရိုးအညွှန်းများတွင် ယခင်ကွက်ကွက်နှစ်ခုနှင့်မတူဘဲ ထပ်ကိန်းများပါရှိကြောင်း သတိပြုပါ။
ထပ်လောင်းအရင်းအမြစ်များ
ggplot2 ခေါင်းစဉ်များအတွက် လမ်းညွှန်ချက်အပြည့်အစုံ
အကောင်းဆုံး ggplot2 အပြင်အဆင်များအတွက် ပြီးပြည့်စုံသော လမ်းညွှန်
ggplot2 တွင် ဘေးချင်းကပ်ကွက်များ ဖန်တီးနည်း
စာရေးသူအကြောင်း
Benjamin Anderson
မင်္ဂလာပါ၊ ကျွန်ုပ်သည် အငြိမ်းစား စာရင်းအင်း ပါမောက္ခ ဘင်ဂျမင်ဖြစ်ပြီး သီးသန့် Statorials ဆရာအဖြစ် လှည့်ပတ်ပါသည်။ စာရင်းဇယားနယ်ပယ်တွင် ကျယ်ပြန့်သောအတွေ့အကြုံနှင့် ကျွမ်းကျင်မှုနှင့်အတူ၊ Statorials မှတစ်ဆင့် ကျောင်းသားများကို ခွန်အားဖြစ်စေရန်အတွက် ကျွန်ုပ်၏အသိပညာကို မျှဝေလိုပါသည်။ ပိုသိတယ်။