Matplotlib တွင် ရှုထောင့်အချိုးကို မည်သို့သတ်မှတ်မည်နည်း။
matplotlib ကွက်ကွက်တစ်ခု၏ ရှုထောင့်အချိုးသည် ဝင်ရိုးစကေးချဲ့ခြင်း၏ ရှုထောင့်ကို ရည်ညွှန်းသည်၊ ဆိုလိုသည်မှာ y ယူနစ်၏အချိုးသည် x ယူနစ်သို့ဖြစ်သည်။
ဤအချိုးကို matplotlib.axes.Axes.set_aspect() လုပ်ဆောင်ချက်ကို အသုံးပြု၍ ပြင်ဆင်နိုင်သည်။
ဘောင်အောက်တွင်၊ set_aspect() function သည် data coordinate system ဟုခေါ်သောအရာကိုအမှန်တကယ်ပြောင်းလဲပေးသည်၊ သို့သော် လက်တွေ့တွင် ကျွန်ုပ်တို့သည် display coordinate system ကို ပြောင်းလဲလိုပါသည်။
ဤပြောင်းလဲခြင်းကို လွယ်ကူချောမွေ့စေရန်၊ ကျွန်ုပ်တို့သည် ဤကုဒ်အပိုင်းအစကို အသုံးပြုနိုင်ပါသည်။
 #define y-unit to x-unit ratio
ratio = 1.0

#get x and y limits
x_left, x_right = ax. get_xlim ()
y_low, y_high = ax. get_ylim ()

#set aspect ratio
ax. set_aspect ( abs ((x_right-x_left)/(y_low-y_high))*ratio)
ဤလုပ်ဆောင်ချက်ကို လက်တွေ့အသုံးချခြင်း၏ ဥပမာတစ်ခုကို ဖြတ်သန်းကြည့်ကြပါစို့။
အဆင့် 1- အခြေခံ Matplotlib Plot ဖန်တီးပါ။
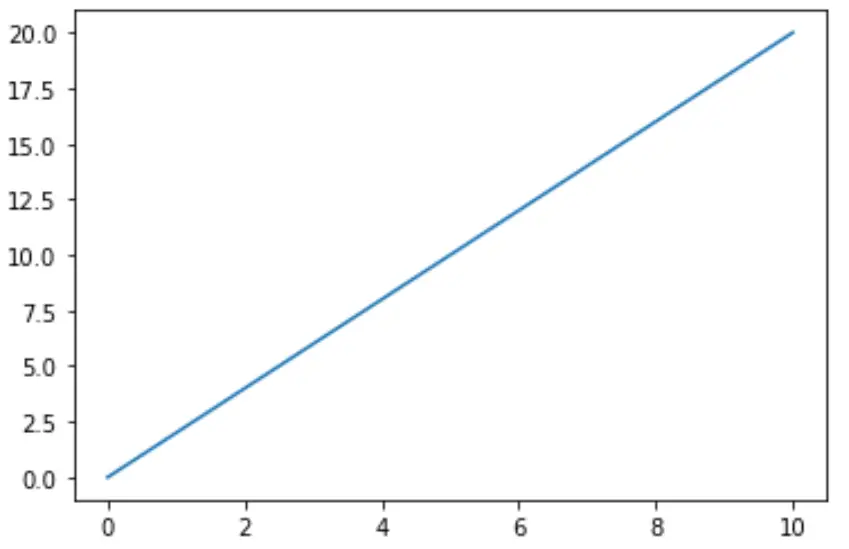
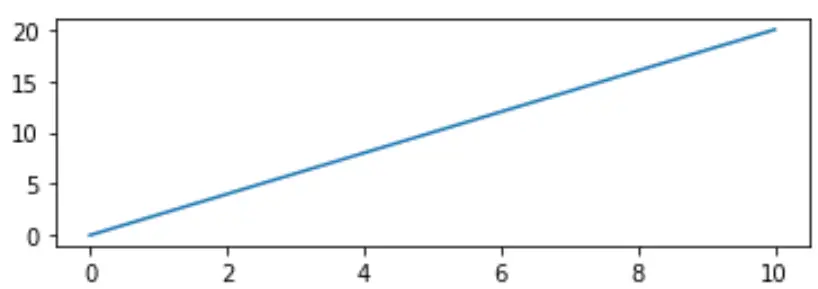
ဦးစွာ Matplotlib ကို အသုံးပြု၍ ရိုးရှင်းသော လိုင်းဇယားကို ဖန်တီးကြပါစို့။
 import matplotlib.pyplot as plt

#define matplotlib figure and axis
fig, ax = plt. subplots ()

#create simple line plot
ax. plot ([0, 10],[0, 20])

#displayplot
plt. show ()
အဆင့် 2- အချိုးအစားကို သတ်မှတ်ပါ (နည်းလမ်းမှား)
x ဝင်ရိုးသည် y ဝင်ရိုးထက် ပိုရှည်သည်ကို သတိပြုပါ။ ရှုထောင့်အချိုးကို 1 အဖြစ် သတ်မှတ်ကြည့်ရအောင်၊ ဆိုလိုသည်မှာ၊ x-axis နှင့် y-axis တို့သည် တူညီသင့်သည်-
 import matplotlib.pyplot as plt

#define matplotlib figure and axis
fig, ax = plt. subplots ()

#create simple line plot
ax. plot ([0, 10],[0, 20])

#attempt to set aspect ratio to 1
ax. set_aspect (1)

#displayplot
plt. show ()
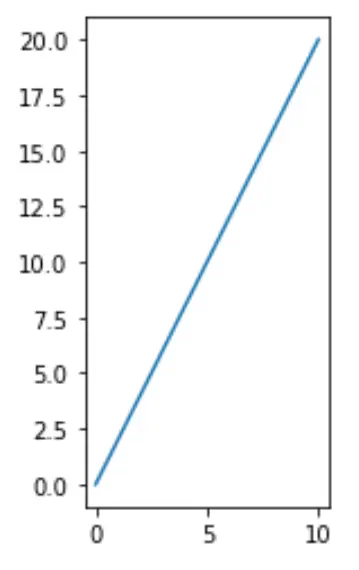
၎င်းသည် မျှော်လင့်ထားသည့်အတိုင်း အလုပ်မဖြစ်ကြောင်း သတိပြုပါ။ y ဝင်ရိုးသည် x ဝင်ရိုးထက် များစွာရှည်သည်။
အဆင့် 3- အချိုးအစားကို သတ်မှတ်ပါ (နည်းမှန်လမ်းမှန်)
မှန်ကန်သောရှုထောင့်အချိုးကို သတ်မှတ်ရန် ရိုးရှင်းသောတွက်ချက်နည်းကို အောက်ပါကုဒ်တွင် ဖော်ပြသည်-
 import matplotlib.pyplot as plt

#define matplotlib figure and axis
fig, ax = plt. subplots ()

#create simple line plot
ax. plot ([0, 10],[0, 20])

#set aspect ratio to 1
ratio = 1.0
x_left, x_right = ax. get_xlim ()
y_low, y_high = ax. get_ylim ()
ax. set_aspect ( abs ((x_right-x_left)/(y_low-y_high))*ratio)

#displayplot
plt. show ()
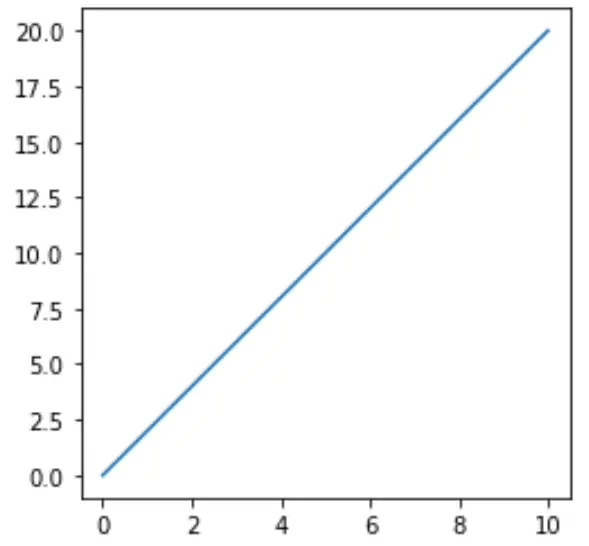
ဤဇာတ်ကွက်တွင် ကျွန်ုပ်တို့မျှော်လင့်ထားသည့် အချိုးအစားရှိသည်ကို သတိပြုပါ။ x-axis နှင့် y-axis သည် အလျား တူညီပါသည်။
အဆင့် 4- ရှုထောင့်အချိုးကို သင်နှစ်သက်သလို ချိန်ညှိပါ။
အကယ်၍ ကျွန်ုပ်တို့သည် y-ဝင်ရိုးကို x-axis ထက် ပိုရှည်လိုပါက၊ ရှုထောင့်အချိုးသည် 1 ထက်ကြီးသော ဂဏန်းဖြစ်ကြောင်း ရိုးရိုးရှင်းရှင်း သတ်မှတ်နိုင်ပါသည်။
 import matplotlib.pyplot as plt

#define matplotlib figure and axis
fig, ax = plt. subplots ()

#create simple line plot
ax. plot ([0, 10],[0, 20])

#set aspect ratio to 3
ratio = 3
x_left, x_right = ax. get_xlim ()
y_low, y_high = ax. get_ylim ()
ax. set_aspect ( abs ((x_right-x_left)/(y_low-y_high))*ratio)

#displayplot
plt. show ()
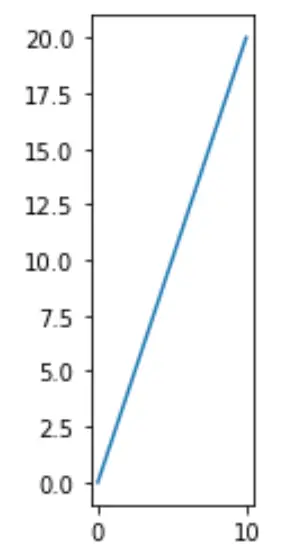
အကယ်၍ ကျွန်ုပ်တို့သည် y-ဝင်ရိုးကို x-axis ထက်တိုစေလိုပါက၊ ရှုထောင့်အချိုးသည် 1 ထက်နည်းသော ဂဏန်းဖြစ်ကြောင်း ရိုးရိုးရှင်းရှင်း သတ်မှတ်နိုင်ပါသည်။
 import matplotlib.pyplot as plt

#define matplotlib figure and axis
fig, ax = plt. subplots ()

#create simple line plot
ax. plot ([0, 10],[0, 20])

#set aspect ratio to .3
ratio = .3
x_left, x_right = ax. get_xlim ()
y_low, y_high = ax. get_ylim ()
ax. set_aspect ( abs ((x_right-x_left)/(y_low-y_high))*ratio)

#displayplot
plt. show ()
Matplotlib သင်ခန်းစာများကို ဤနေရာတွင် သင်ရှာဖွေနိုင်ပါသည်။
စာရေးသူအကြောင်း
Benjamin Anderson
မင်္ဂလာပါ၊ ကျွန်ုပ်သည် အငြိမ်းစား စာရင်းအင်း ပါမောက္ခ ဘင်ဂျမင်ဖြစ်ပြီး သီးသန့် Statorials ဆရာအဖြစ် လှည့်ပတ်ပါသည်။ စာရင်းဇယားနယ်ပယ်တွင် ကျယ်ပြန့်သောအတွေ့အကြုံနှင့် ကျွမ်းကျင်မှုနှင့်အတူ၊ Statorials မှတစ်ဆင့် ကျောင်းသားများကို ခွန်အားဖြစ်စေရန်အတွက် ကျွန်ုပ်၏အသိပညာကို မျှဝေလိုပါသည်။ ပိုသိတယ်။