Seaborn plots တွင် ခေါင်းစဉ်တစ်ခုထည့်နည်း (ဥပမာများဖြင့်)
အဏ္ဏဝါကွက်တစ်ခုသို့ ခေါင်းစဉ်တစ်ခုထည့်ရန်၊ သင်သည် .set() လုပ်ဆောင်ချက်ကို အသုံးပြုနိုင်သည်။
ဥပမာအားဖြင့်၊ ဤနေရာတွင် ခေါင်းစဉ်တစ်ခုအား boxplot တစ်ခုသို့ထည့်နည်း။
sns. boxplot (data=df, x=' var1 ', y=' var2 '). set (title=' Title of Plot ')
အဏ္ဏဝါမျက်နှာပုံကွက်ကွက်တစ်ခုသို့ ကမ္ဘာလုံးဆိုင်ရာခေါင်းစဉ်တစ်ခုထည့်ရန်၊ သင်သည် .suptitle() လုပ်ဆောင်ချက်ကို အသုံးပြုနိုင်သည်။
ဥပမာအားဖြင့်၊ ဤနေရာတွင် ကမ္ဘာလုံးဆိုင်ရာ ခေါင်းစဉ်တစ်ခုအား ပြန်လည်အသုံးချမှုတစ်ခုတွင် ထည့်သွင်းနည်းမှာ ဤတွင်ဖြစ်သည်။
 #define relplot
rel = sns. relplot (data=df, x=' var1 ', y=' var2 ', col=' var3 ')

#add overall title to replot
rel. fig . suptitle (' Overall Title ')
အောက်ဖော်ပြပါ ဥပမာများသည် ဤလုပ်ဆောင်ချက်များကို လက်တွေ့အသုံးချနည်းကို ပြသထားသည်။
ဥပမာ 1- Seaborn ဇာတ်ကွက်တစ်ခုသို့ ခေါင်းစဉ်တစ်ခုထည့်ပါ။
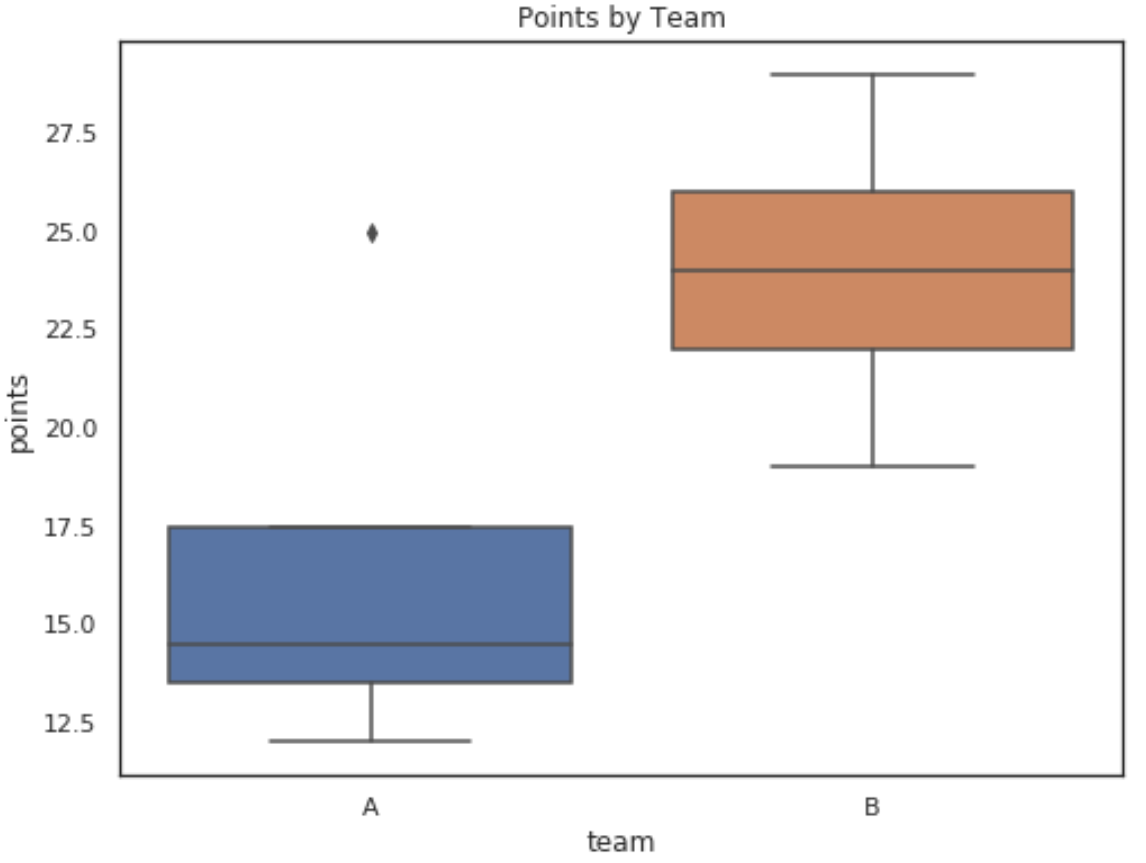
အောက်ပါကုဒ်သည် Seaborn boxplot တွင် ခေါင်းစဉ်တစ်ခုထည့်နည်းကို ပြသသည်-
 import pandas as pd
import seaborn as sns
import matplotlib. pyplot as plt

#create fake data
df = pd. DataFrame ({' points ': [25, 12, 15, 14, 19, 23, 25, 29],
                   ' assists ': [5, 7, 7, 9, 12, 9, 9, 4],
                   ' team ': ['A', 'A', 'A', 'A', 'B', 'B', 'B', 'B']})

#create boxplot
sns. boxplot (data=df, x=' team ', y=' points '). set (title=' Points by Team ')
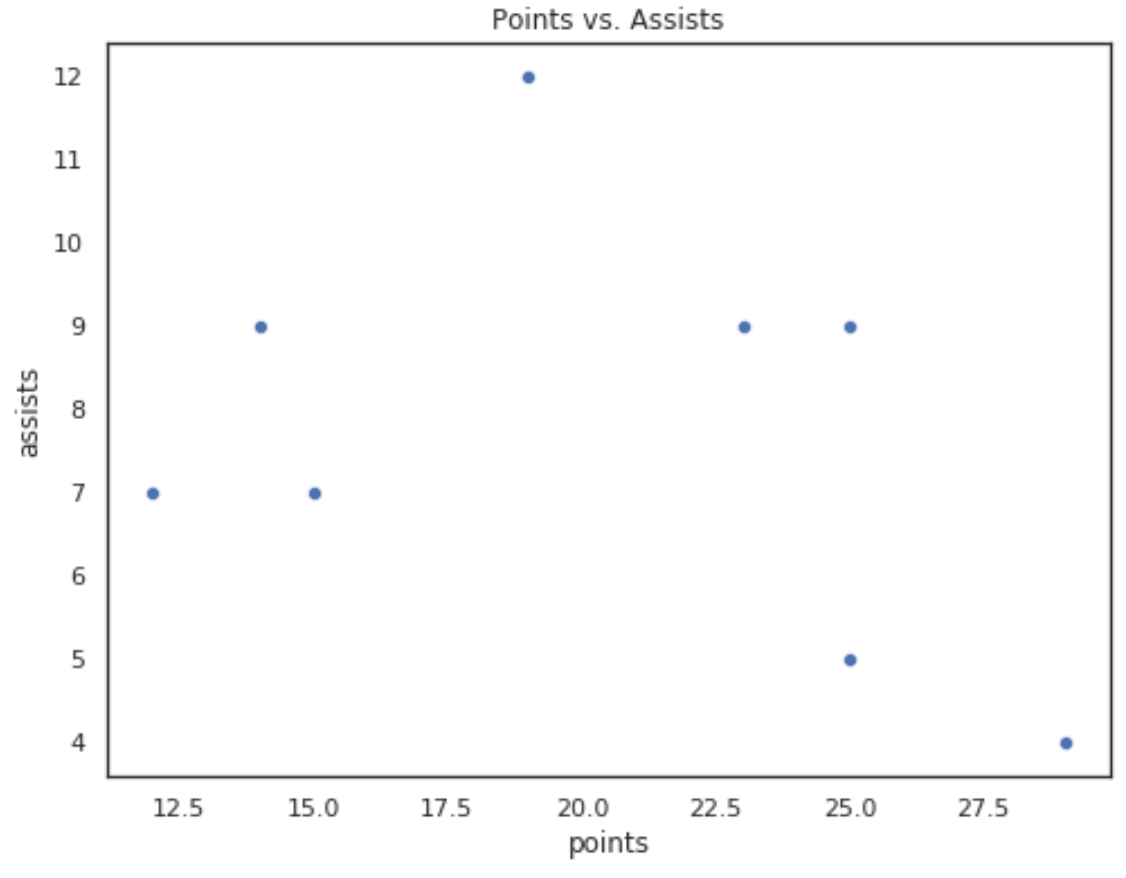
အောက်ဖော်ပြပါကုဒ်သည် အဏ္ဏဝါဖြန့်ကျက်မှုတစ်ခုသို့ ခေါင်းစဉ်တစ်ခုထည့်နည်းကို ပြသသည်-
sns. scatterplot (data=df, x=' points ', y=' assists '). set (title=' Points vs. Assists ')
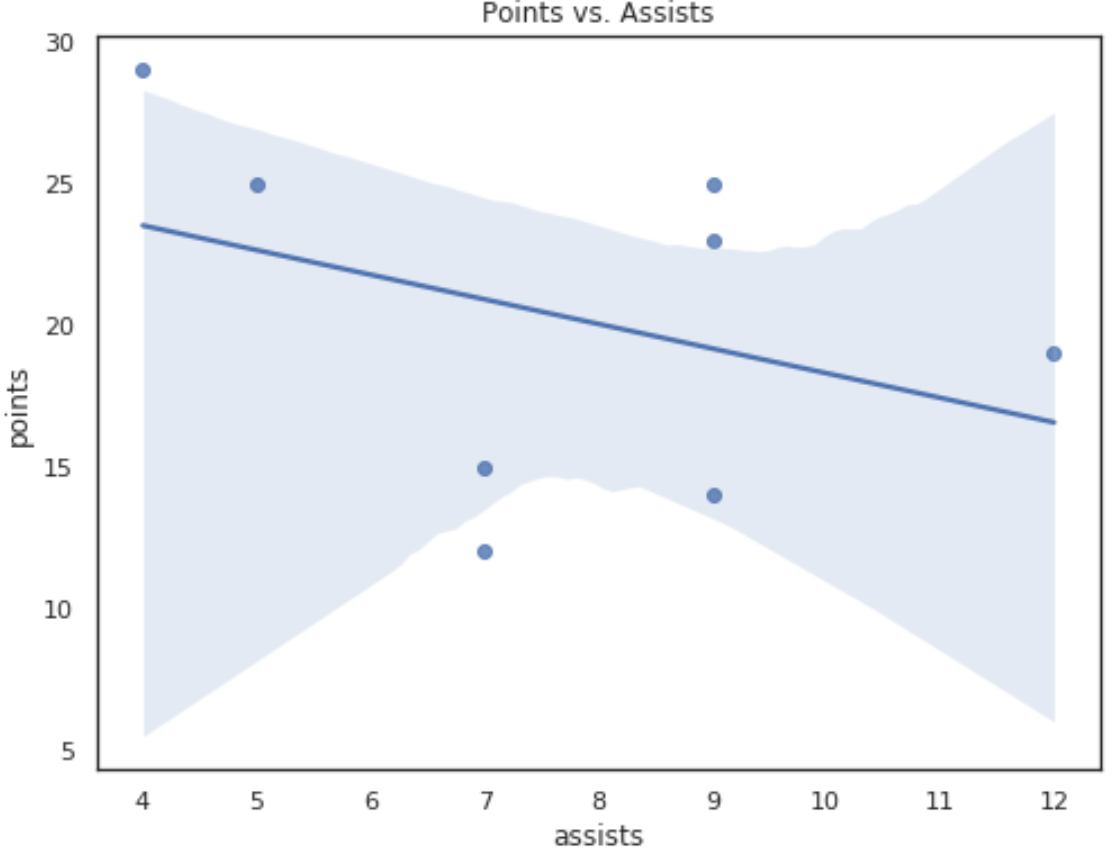
အောက်ဖော်ပြပါကုဒ်သည် Seaborn regplot သို့ ခေါင်းစဉ်တစ်ခုထည့်နည်းကို ပြသသည်-
sns. regplot (data=df, x=' points ', y=' assists '). set (title=' Points vs. Assists ')
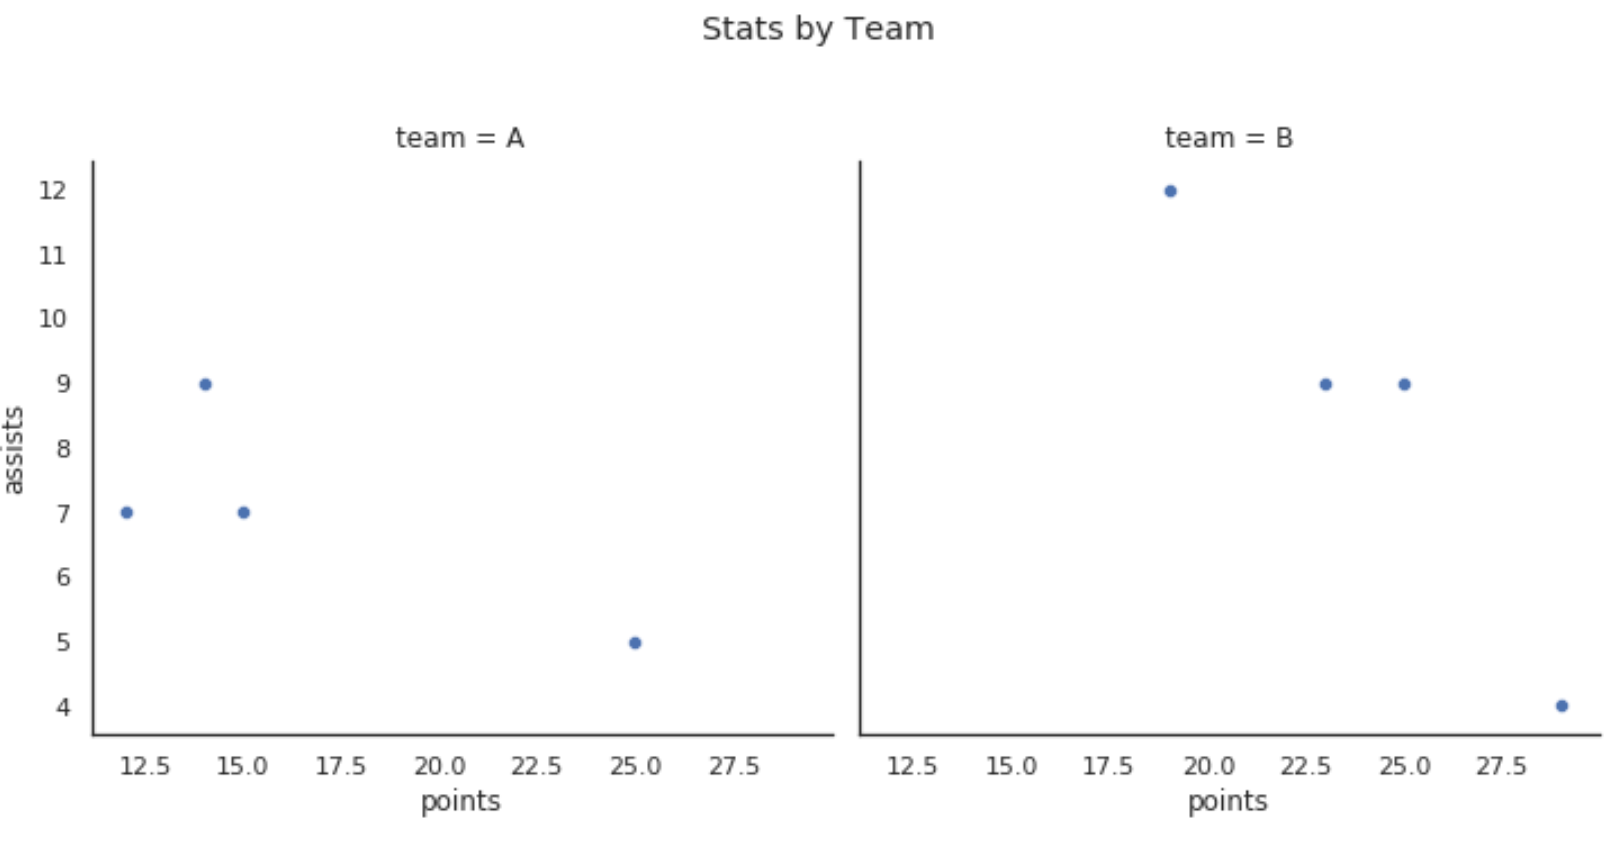
ဥပမာ 2- Seaborn Face Plot သို့ ကမ္ဘာလုံးဆိုင်ရာ ခေါင်းစဉ်တစ်ခု ထည့်ပါ။
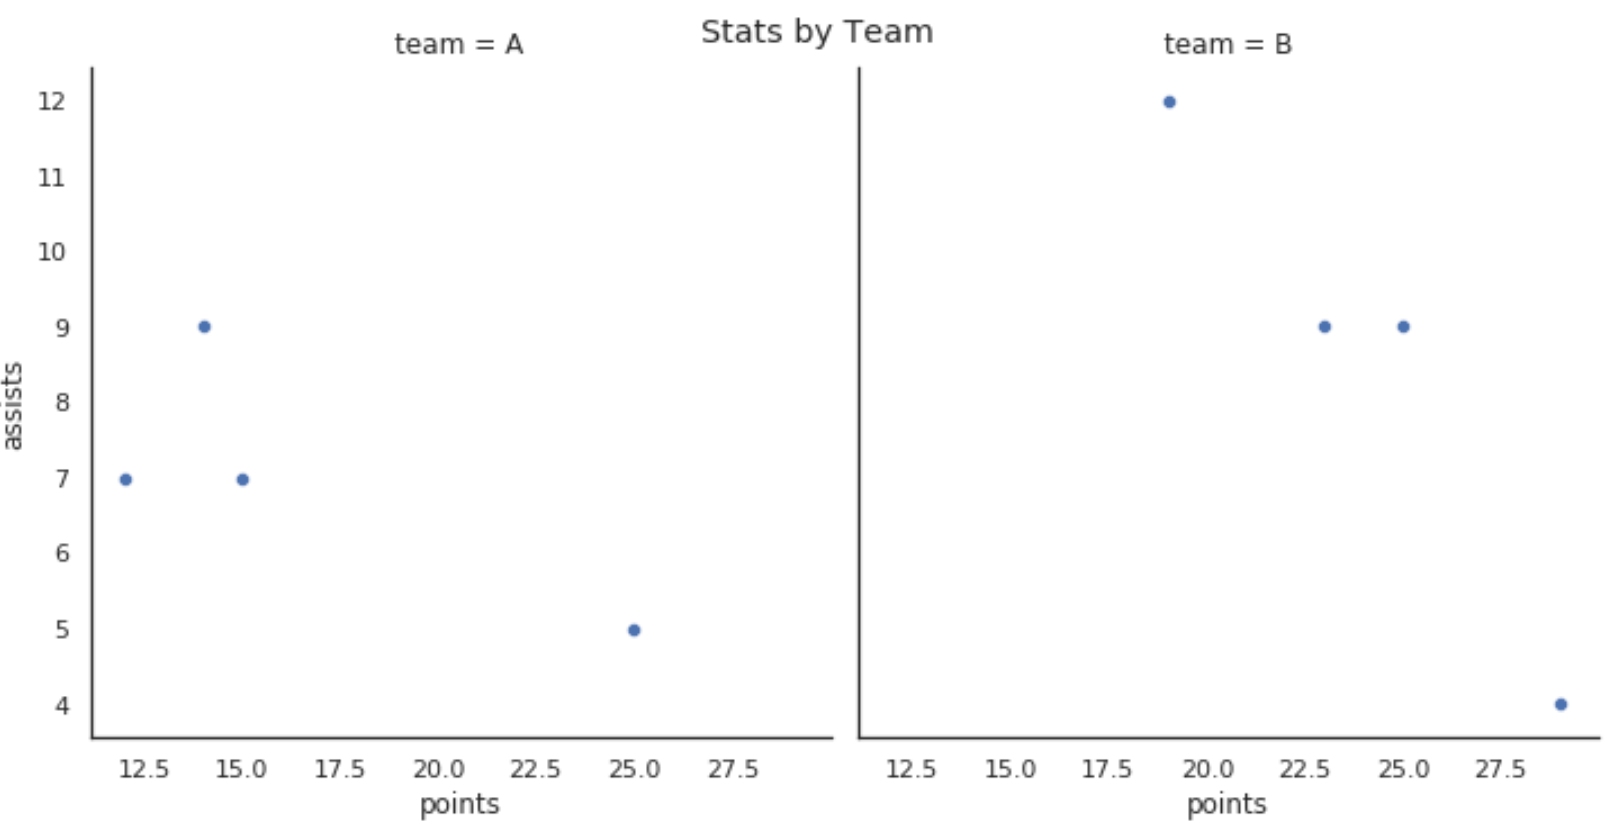
အောက်ဖော်ပြပါ ကုဒ်သည် Seaborn faceted plot တွင် ခေါင်းစဉ်တစ်ခု ထည့်နည်းကို ပြသည်-
 import pandas as pd
import seaborn as sns
import matplotlib. pyplot as plt

#create fake data
df = pd. DataFrame ({' points ': [25, 12, 15, 14, 19, 23, 25, 29],
                   ' assists ': [5, 7, 7, 9, 12, 9, 9, 4],
                   ' team ': ['A', 'A', 'A', 'A', 'B', 'B', 'B', 'B']})

#create relplot
rel = sns. relplot (data=df, x=' points ', y=' assists ', col=' team ')

#add overall title
rel. fig . suptitle (' Stats by Team ')
subplots_adjust() အငြင်းအခုံကိုလည်း အသုံးပြု၍ ခေါင်းစဉ်တစ်ခုလုံးကို အနည်းငယ်မြင့်အောင်ရွှေ့ရန်၊
 #create relplot
rel = sns. relplot (data=df, x=' points ', y=' assists ', col=' team ')

#move overall title up
rel. fig . subplots_adjust (top= .8 )

#add overall title
rel. fig . suptitle (' Stats by Team ')
ထပ်လောင်းအရင်းအမြစ်များ
Seaborn ဇာတ်ကွက်၏ ပုံအရွယ်အစားကို ချိန်ညှိနည်း
Seaborn မှာ ဒဏ္ဍာရီတစ်ယောက်ရဲ့ အနေအထားကို ဘယ်လိုပြောင်းမလဲ။
Seaborn ကွက်တွင် ဝင်ရိုးအညွှန်းများကို မည်သို့ပြောင်းရမည်နည်း။
စာရေးသူအကြောင်း
Benjamin Anderson
မင်္ဂလာပါ၊ ကျွန်ုပ်သည် အငြိမ်းစား စာရင်းအင်း ပါမောက္ခ ဘင်ဂျမင်ဖြစ်ပြီး သီးသန့် Statorials ဆရာအဖြစ် လှည့်ပတ်ပါသည်။ စာရင်းဇယားနယ်ပယ်တွင် ကျယ်ပြန့်သောအတွေ့အကြုံနှင့် ကျွမ်းကျင်မှုနှင့်အတူ၊ Statorials မှတစ်ဆင့် ကျောင်းသားများကို ခွန်အားဖြစ်စေရန်အတွက် ကျွန်ုပ်၏အသိပညာကို မျှဝေလိုပါသည်။ ပိုသိတယ်။