Seaborn တွင် အပိုင်းခွဲများ ဖန်တီးနည်း (ဥပမာများနှင့်အတူ)
Python ရှိ Seaborn data visualization library တွင် အပိုင်းခွဲများဖန်တီးရန် အောက်ပါအခြေခံ syntax ကို အသုံးပြုနိုင်ပါသည်။
 #define dimensions of subplots (rows, columns)
fig, axes = plt. subplots (2, 2)

#create chart in each subplot
sns. boxplot (data=df, x=' team ', y=' points ', ax=axes[0,0])
sns. boxplot (data=df, x=' team ', y=' assists ', ax=axes[0,1])

...
အောက်ဖော်ပြပါ ဥပမာသည် ဤ syntax ကို လက်တွေ့တွင် မည်သို့အသုံးပြုရမည်ကို ပြသထားသည်။
ဥပမာ- Seaborn တွင် အပိုင်းခွဲများ ဖန်တီးခြင်း။
ကျွန်ုပ်တို့တွင် အောက်ပါ ပန်ဒါ DataFrame ရှိသည် ဆိုပါစို့။
 import pandas as pd

#createDataFrame
df = pd. DataFrame ({' team ': ['A', 'A', 'A', 'A', 'B', 'B', 'B', 'B'],
                   ' points ': [19, 12, 15, 14, 19, 23, 25, 29],
                   ' assists ': [13, 15, 11, 8, 6, 8, 11, 14],
                   ' rebounds ': [11, 7, 8, 12, 13, 7, 6, 8],
                   ' blocks ': [1, 2, 2, 3, 5, 4, 3, 3]})

#view DataFrame
print (df)

  team points assists rebounds blocks
0 A 19 13 11 1
1 A 12 15 7 2
2 A 15 11 8 2
3 A 14 8 12 3
4 B 19 6 13 5
5 B 23 8 7 4
6 B 25 11 6 3
7 B 29 14 8 3
အောက်ပါကုဒ်သည် အတန်းနှစ်တန်းနှင့် ကော်လံနှစ်ခုပါသည့် ကွက်ကွက်ဒေသကို မည်သို့သတ်မှတ်ရမည်ကို ပြသပြီး DataFrame ရှိ ကိန်းဂဏာန်းလေးမျိုးမှ တစ်ခုစီအတွက် အပိုင်းခွဲတစ်ခုစီတွင် boxplot တစ်ခုကို ဖန်တီးပါ။
 import matplotlib. pyplot as plt
import seaborn as sns

#set seaborn plotting aesthetics as default
sns. set ()

#define plotting region (2 rows, 2 columns)
fig, axes = plt. subplots (2, 2)

#create boxplot in each subplot
sns. boxplot (data=df, x=' team ', y=' points ', ax=axes[0,0])
sns. boxplot (data=df, x=' team ', y=' assists ', ax=axes[0,1])
sns. boxplot (data=df, x=' team ', y=' rebounds ', ax=axes[1,0])
sns. boxplot (data=df, x=' team ', y=' blocks ', ax=axes[1,1])
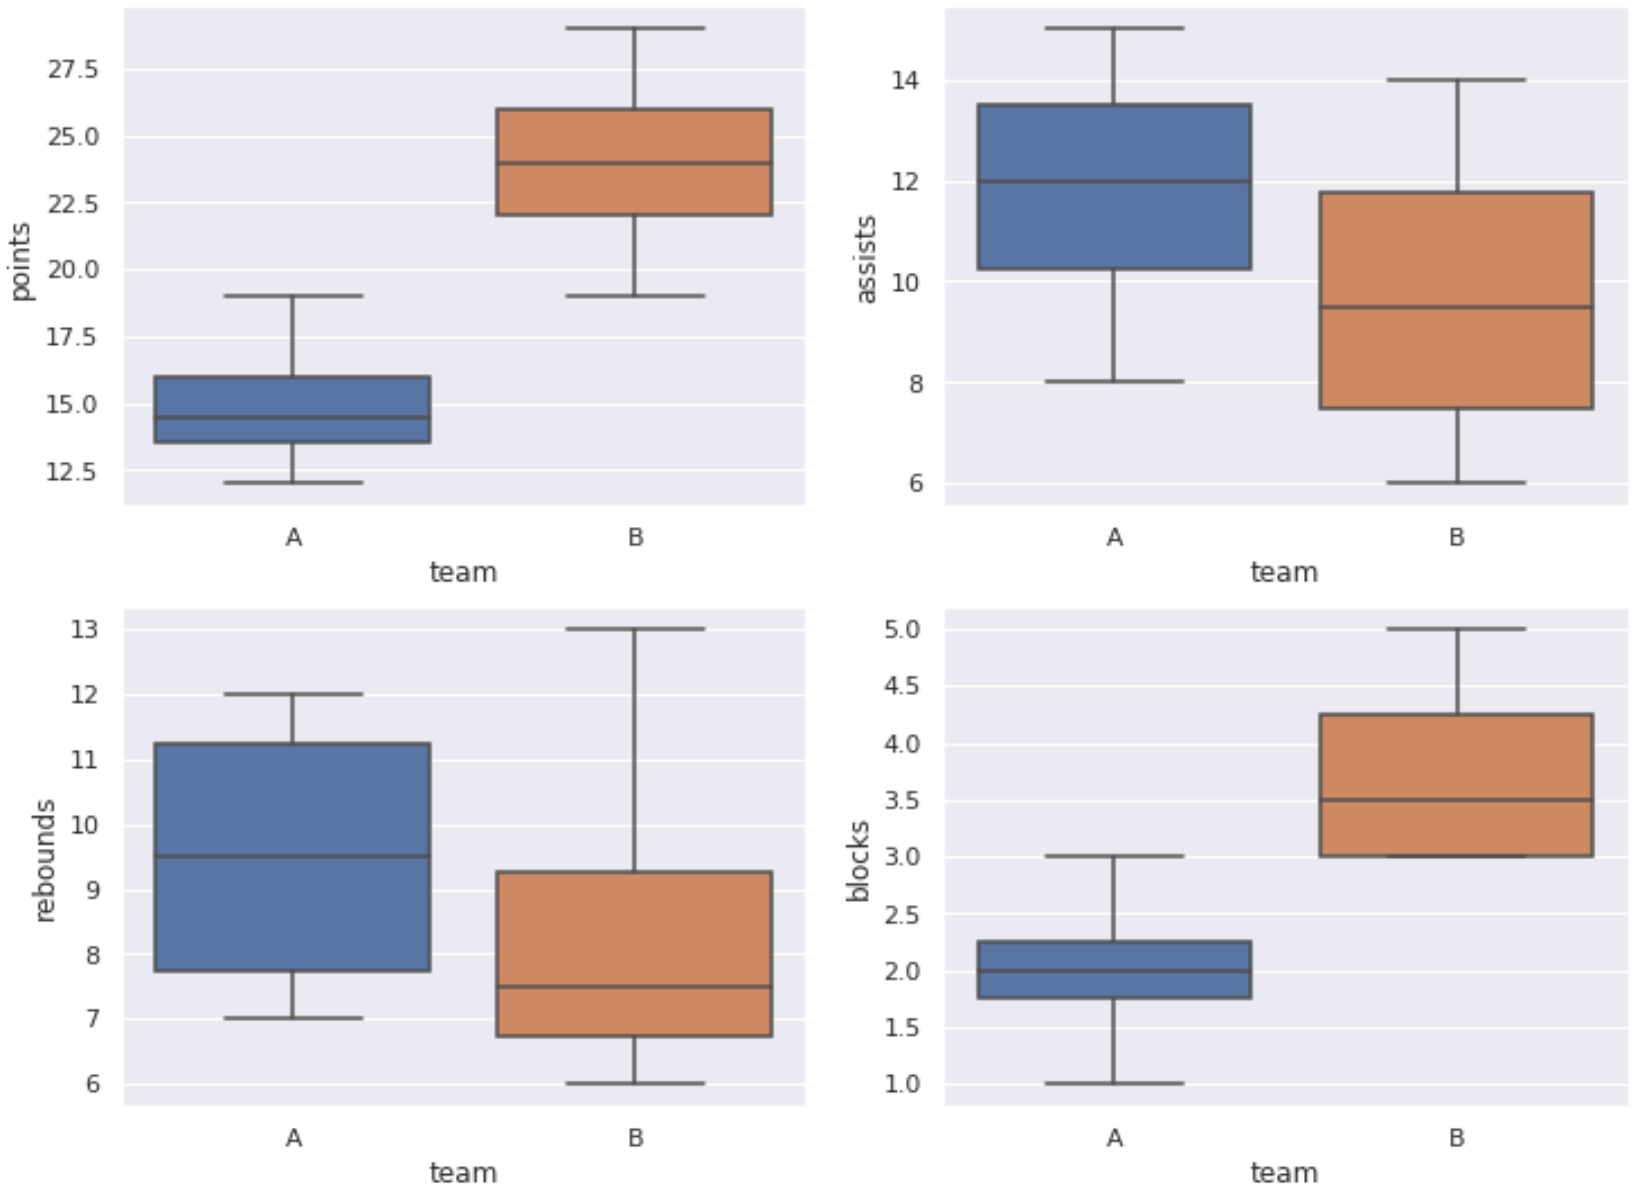
ဤဥပမာတွင်၊ ကျွန်ုပ်တို့သည် အတန်းနှစ်ခုနှင့် ကော်လံနှစ်ခုပါသည့် ကွက်ကွက်ဒေသတစ်ခုကို ဖန်တီးပြီး အပိုင်းတစ်ခုစီကို boxplots များဖြင့် ဖြည့်ထားသည်။
သို့သော်၊ မတူညီသောအတိုင်းအတာများဖြင့် ကွက်ကွက်ဒေသတစ်ခုကို ဖန်တီးရန်နှင့် ကွဲပြားသောဂရပ်များဖြင့် အပိုင်းခွဲများကို ဖြည့်သွင်းရန်အတွက် ဆင်တူသော syntax ကို အသုံးပြုနိုင်ပါသည်။
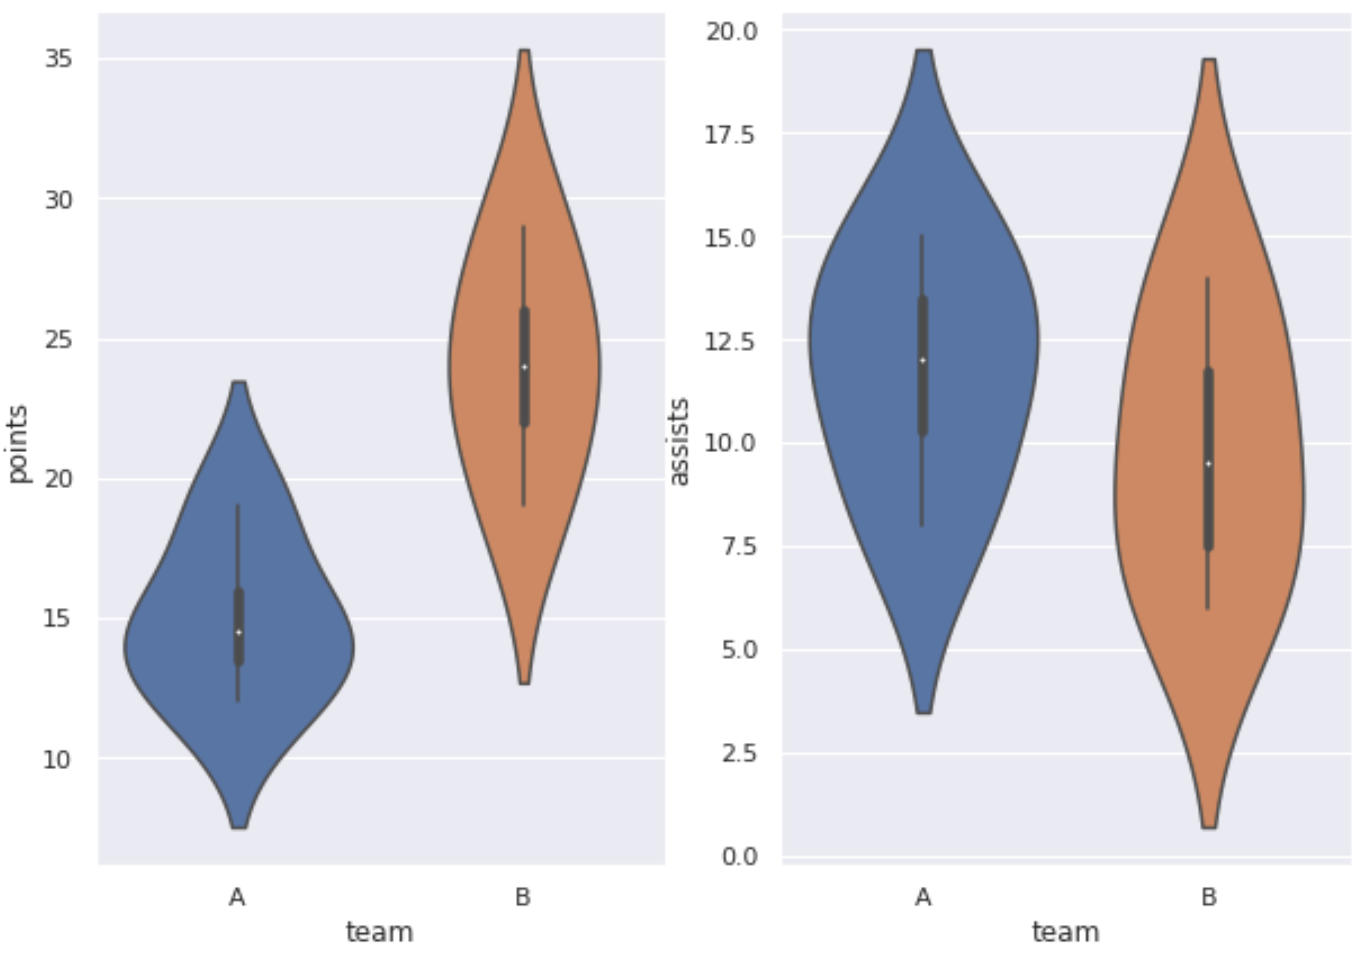
ဥပမာအားဖြင့်၊ အောက်ပါကုဒ်သည် အတန်းတစ်ခုနှင့် ကော်လံနှစ်ခုပါသည့် ကွက်ကွက်ဒေသတစ်ခုကို ဖန်တီးနည်းကို ပြသပြီး ကွက်တစ်ခုစီကို တယောဆွဲကွက်တစ်ခုဖြင့် ဖြည့်စွက်သည်-
 import matplotlib. pyplot as plt
import seaborn as sns

#set seaborn plotting aesthetics as default
sns. set ()

#define plotting region (1 row, 2 columns)
fig, axes = plt. subplots (1, 2)

#create boxplot in each subplot
sns. violinplot (data=df, x=' team ', y=' points ', ax=axes[0])
sns. violinplot (data=df, x=' team ', y=' assists ', ax=axes[1])
ထပ်လောင်းအရင်းအမြစ်များ
အောက်ဖော်ပြပါ သင်ခန်းစာများသည် ပင်လယ်မွေးတွင် အခြားဘုံလုပ်ဆောင်ချက်များကို မည်သို့လုပ်ဆောင်ရမည်ကို ရှင်းပြသည်-
Seaborn Plots တွင် ခေါင်းစဉ်တစ်ခုထည့်နည်း
Seaborn ဇာတ်ကွက်ကို ဖိုင်တစ်ခုသို့ မည်သို့သိမ်းဆည်းမည်နည်း။
Seaborn မှာ ဒဏ္ဍာရီတစ်ယောက်ရဲ့ အနေအထားကို ဘယ်လိုပြောင်းမလဲ။
စာရေးသူအကြောင်း
Benjamin Anderson
မင်္ဂလာပါ၊ ကျွန်ုပ်သည် အငြိမ်းစား စာရင်းအင်း ပါမောက္ခ ဘင်ဂျမင်ဖြစ်ပြီး သီးသန့် Statorials ဆရာအဖြစ် လှည့်ပတ်ပါသည်။ စာရင်းဇယားနယ်ပယ်တွင် ကျယ်ပြန့်သောအတွေ့အကြုံနှင့် ကျွမ်းကျင်မှုနှင့်အတူ၊ Statorials မှတစ်ဆင့် ကျောင်းသားများကို ခွန်အားဖြစ်စေရန်အတွက် ကျွန်ုပ်၏အသိပညာကို မျှဝေလိုပါသည်။ ပိုသိတယ်။