Cirkels plotten in matplotlib (met voorbeelden)
U kunt snel cirkels toevoegen aan een plot in Matplotlib met behulp van de functie Circle() , die de volgende syntaxis gebruikt:
matplotlib.patches.Circle(xy, straal=5)
Goud:
- xy: de coördinaten (x, y) van de cirkel
- straal: De straal van de cirkel. De standaardwaarde is 5.
Deze tutorial toont verschillende voorbeelden van praktisch gebruik van deze functie:
Voorbeeld 1: Maak één cirkel
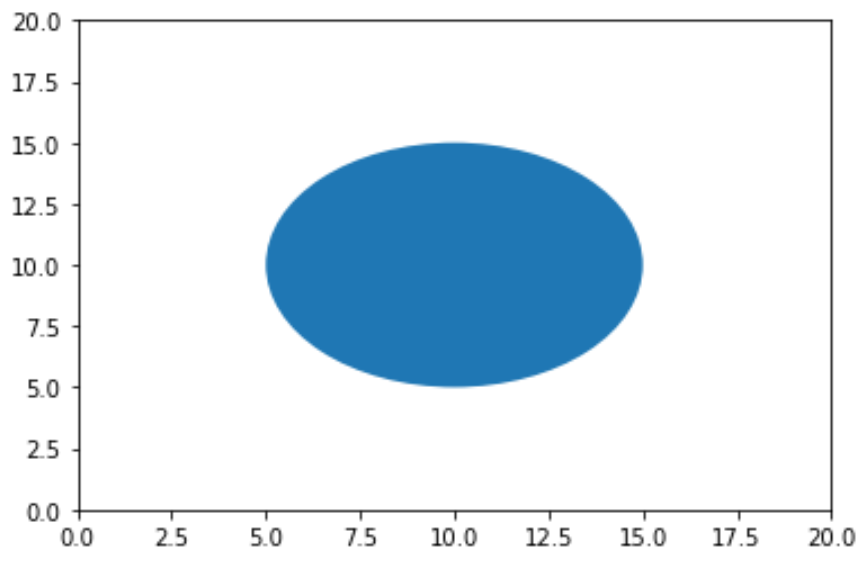
De volgende code laat zien hoe u een enkele cirkel maakt op een Matplotlib-plot op de coördinaten (x,y)(10,10):
 import matplotlib. pyplot as plt

#set axis limits of plot (x=0 to 20, y=0 to 20)
plt. axis ([0, 20, 0, 20])

#create circle with (x, y) coordinates at (10, 10)
c=plt. Circle ((10, 10))

#add circle to plot (gca means "get current axis")
plt. gca (). add_artist (c)

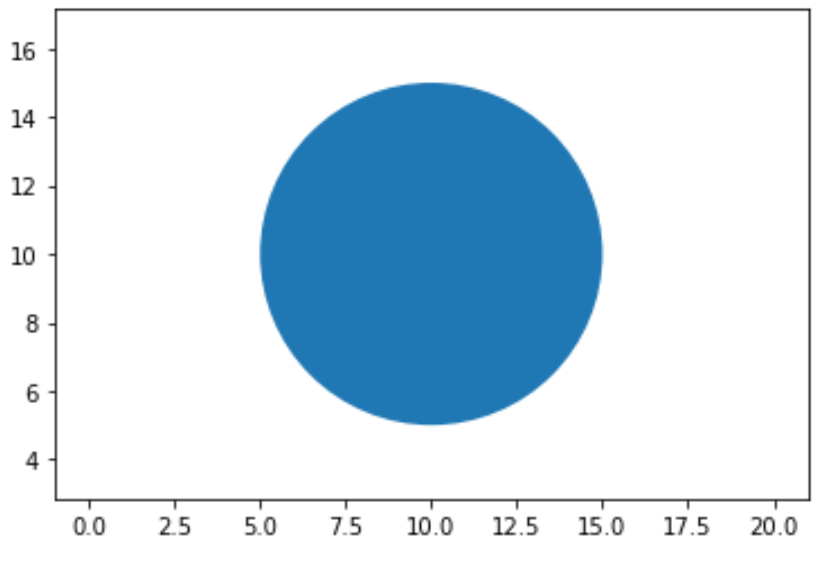
Standaard geeft een as van een Matplotlib-plot doorgaans meer pixels per gegevenseenheid weer. Om een cirkel als een cirkel te laten verschijnen in plaats van als een ellips, moet je het argument plt.axis(“equal”) als volgt gebruiken:
 import matplotlib. pyplot as plt

#set axis limits of plot (x=0 to 20, y=0 to 20)
plt. axis ([0, 20, 0, 20])
plt. axis (" equal ")

#create circle with (x, y) coordinates at (10, 10)
c=plt. Circle ((10, 10))

#add circle to plot (gca means "get current axis")
plt. gca (). add_artist (c)

Voorbeeld 2: Maak meerdere kringen
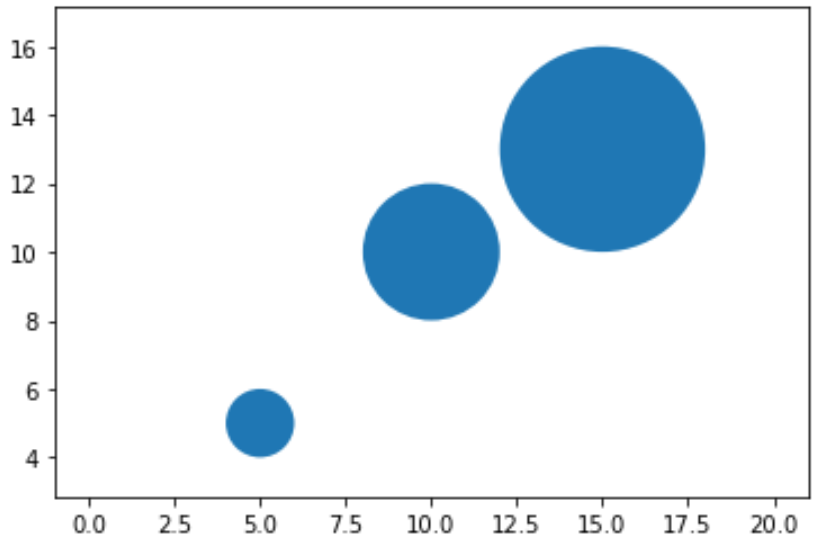
De volgende code laat zien hoe u meerdere cirkels kunt maken op een Matplotlib-plot:
 import matplotlib. pyplot as plt

#set axis limits of plot (x=0 to 20, y=0 to 20)
plt. axis ([0, 20, 0, 20])
plt. axis (" equal ")

#define circles
c1=plt. Circle ((5, 5), radius= 1 )
c2=plt. Circle ((10, 10), radius= 2 )
c3=plt. Circle ((15, 13), radius= 3 )

#add circles to plot
plt. gca (). add_artist (c1)
plt. gca (). add_artist (c2)
plt. gca (). add_artist (c3)

Voorbeeld 3: Verander het uiterlijk van de cirkel
U kunt de volgende argumenten gebruiken om het uiterlijk van een cirkel in Matplotlib te wijzigen:
- straal: specificeer de straal van de cirkel
- kleur: specificeer de kleur van de cirkel
- alpha: specificeer de transparantie van de cirkel
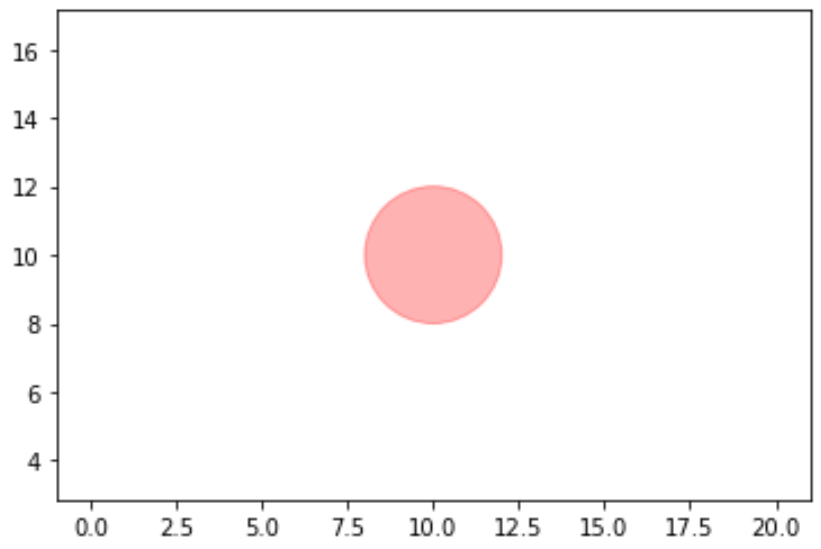
De volgende code toont een voorbeeld van hoe u meerdere van deze argumenten tegelijk kunt gebruiken:
 import matplotlib. pyplot as plt

#set axis limits of plot (x=0 to 20, y=0 to 20)
plt. axis ([0, 20, 0, 20])
plt. axis (" equal ")

#create circle with (x, y) coordinates at (10, 10)
c=plt. Circle ((10, 10), radius= 2 , color=' red ', alpha= .3 )

#add circle to plot (gca means "get current axis")
plt. gca (). add_artist (c)

Houd er rekening mee dat u ook aangepaste hexadecimale kleurcodes kunt gebruiken om de kleur van de cirkels op te geven.