Hoe fig.add_subplot te gebruiken in matplotlib
U kunt de volgende basissyntaxis gebruiken om subplots in Matplotlib te maken:
 import matplotlib. pyplot as plt

#define figure
fig = plt. figure ()

#add first subplot in layout that has 3 rows and 2 columns
fig. add_subplot (321)

#add fifth subplot in layout that has 3 rows and 2 columns
fig. add_subplot (325)

...
De volgende voorbeelden laten zien hoe u deze syntaxis in de praktijk kunt gebruiken.
Voorbeeld 1: Subplots toevoegen met een uniforme lay-out
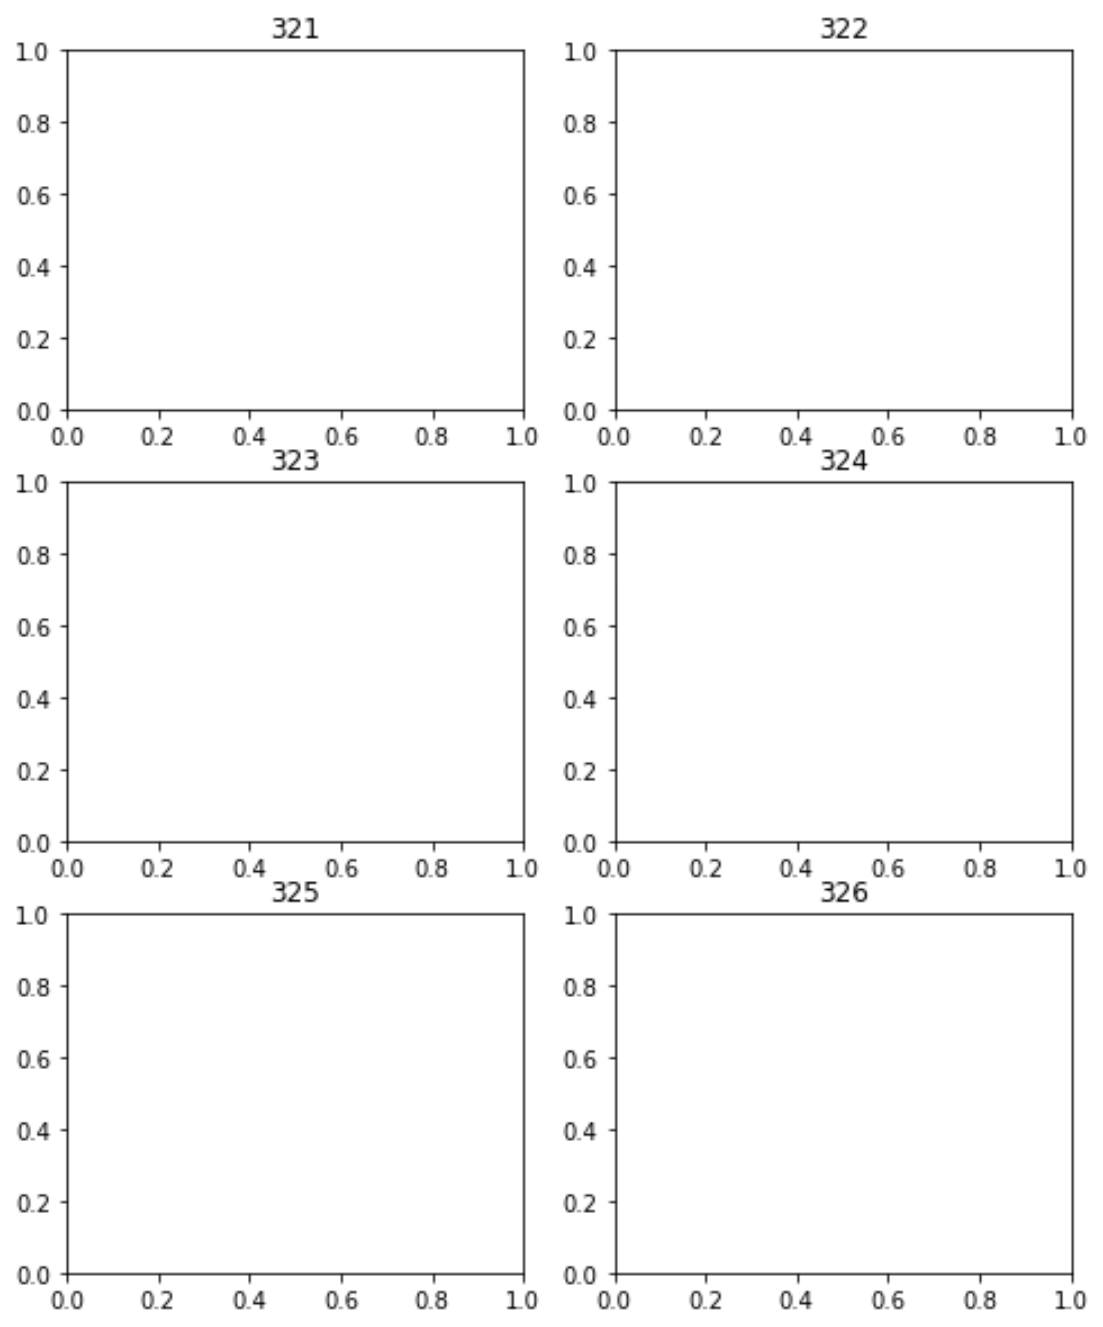
De volgende code laat zien hoe u zes subplots maakt in een lay-out met 3 rijen en 2 kolommen:
 import matplotlib. pyplot as plt

#define figure
fig = plt. figure ()

#add subplots
fig. add_subplot (321). set_title (' 321 ')
fig. add_subplot (322). set_title (' 322 ')
fig. add_subplot (323). set_title (' 323 ')
fig. add_subplot (324). set_title (' 324 ')
fig. add_subplot (325). set_title (' 325 ')
fig. add_subplot (326). set_title (' 326 ')

#display plots
plt. show ()

Merk op dat het resultaat zes subplots is, weergegeven in een lay-out met 3 rijen en 2 kolommen.
Voorbeeld 2: Subplots met ongelijkmatige lay-out toevoegen
De volgende code laat zien hoe u als volgt vier subplots maakt:
- Drie van de plots zijn gemaakt in een raster van 3 rijen en 2 kolommen.
- De vierde plot wordt gemaakt in een raster met 1 rij en 2 kolommen.
 import matplotlib. pyplot as plt

#define figure
fig = plt. figure ()

#add subplots
fig. add_subplot (321). set_title (' 321 ')
fig. add_subplot (323). set_title (' 323 ')
fig. add_subplot (325). set_title (' 325 ')
fig. add_subplot (122). set_title (' 122 ')

#display plots
plt. show ()

Het eindresultaat is drie subplots die worden weergegeven in een 3×2-raster, terwijl de laatste subplot wordt weergegeven in een 1×2-raster.
Aanvullende bronnen
In de volgende tutorials wordt uitgelegd hoe u andere veelvoorkomende bewerkingen in Matplotlib kunt uitvoeren:
Hoe u de afstand tussen Matplotlib-subplots kunt aanpassen
Hoe de subplotgrootte in Matplotlib aan te passen
Hoe u een titel aan subplots in Matplotlib toevoegt