Hoe u een belcurve maakt in python
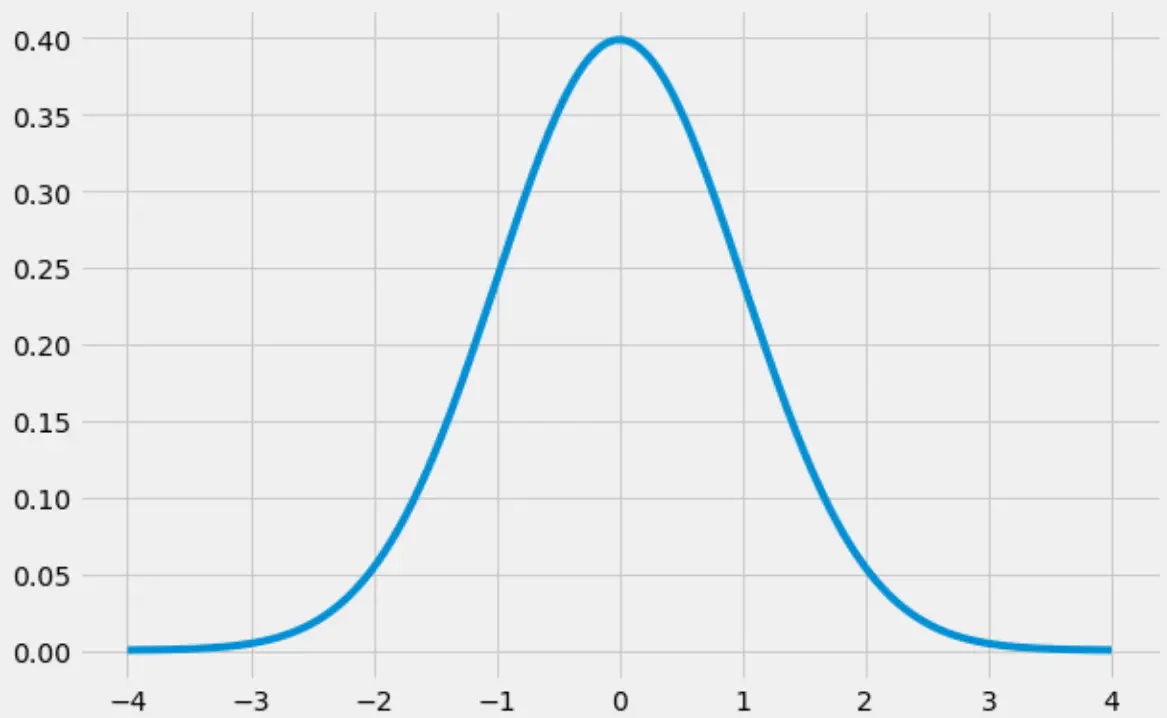
Een „belcurve“ is de bijnaam die wordt gegeven aan de vorm van eennormale verdeling , die een duidelijke „bel“ -vorm heeft:

In deze tutorial wordt uitgelegd hoe u een belcurve in Python maakt.
Hoe u een belcurve maakt in Python
De volgende code laat zien hoe u een belcurve maakt met behulp van de bibliotheken numpy , scipy en matplotlib :
 import numpy as np
import matplotlib.pyplot as plt
from scipy.stats import norm

#create range of x-values from -4 to 4 in increments of .001
x = np.arange(-4, 4, 0.001)

#create range of y-values that correspond to normal pdf with mean=0 and sd=1
y = norm.pdf(x,0,1)

#defineplot
fig, ax = plt.subplots(figsize=(9,6))
ax.plot(x,y)

#choose plot style and display the bell curve
plt.style.use('fivethirtyeight')
plt.show()

Hoe een belcurve in Python te vullen
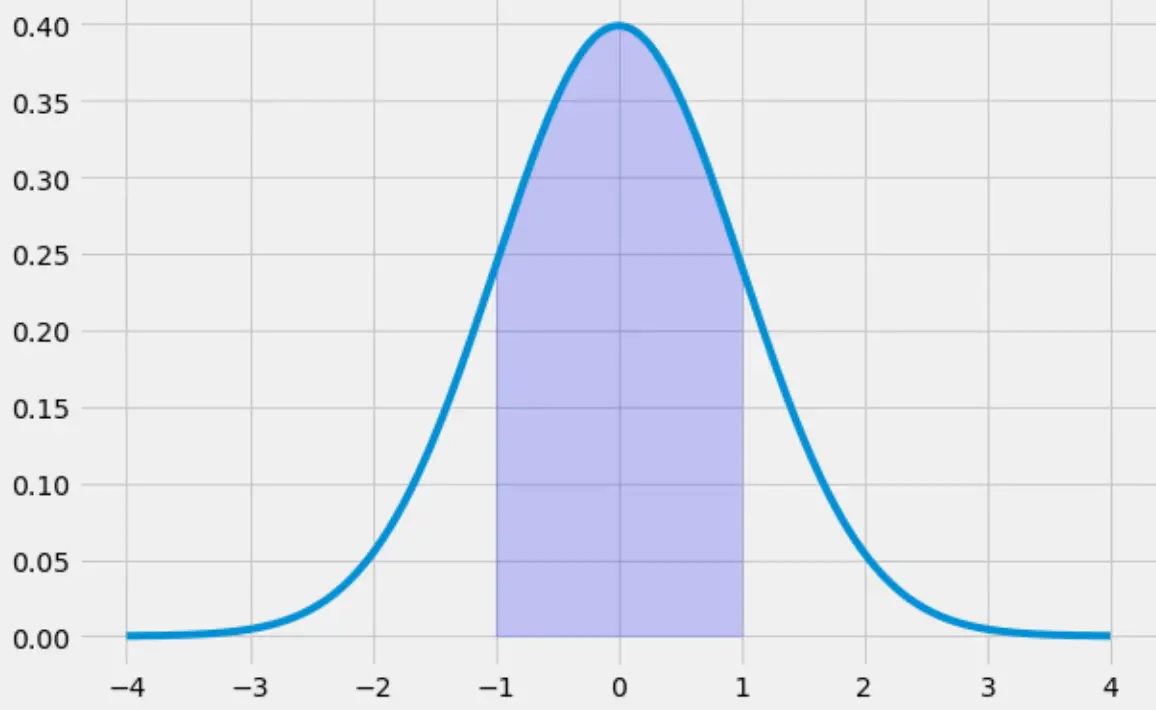
De volgende code illustreert hoe u het gebied onder de belcurve vult, gaande van -1 tot 1:
 x = np.arange(-4, 4, 0.001)
y = norm.pdf(x,0,1)

fig, ax = plt.subplots(figsize=(9,6))
ax.plot(x,y)

#specify the region of the bell curve to fill in
x_fill = np.arange(-1, 1, 0.001)
y_fill = norm.pdf(x_fill,0,1)
ax.fill_between(x_fill,y_fill,0, alpha=0.2, color='blue')

plt.style.use('fivethirtyeight')
plt.show()

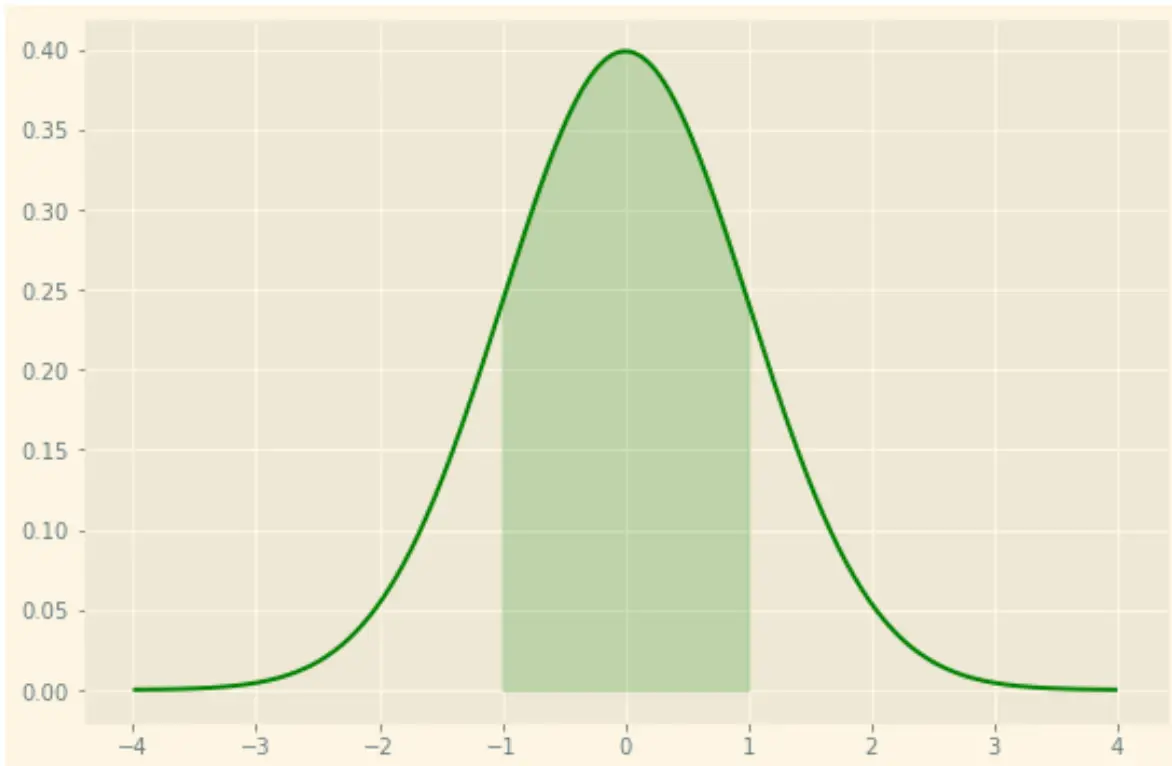
Merk op dat u de plot ook kunt opmaken zoals u dat wilt, met behulp van de vele stijlopties van matplotlib . U kunt bijvoorbeeld een ‘zonlicht’-thema gebruiken met een groene lijn en groene arcering:
 x = np.arange(-4, 4, 0.001)
y = norm.pdf(x,0,1)

fig, ax = plt.subplots(figsize=(9,6))
ax.plot(x,y, color=' green ')

#specify the region of the bell curve to fill in
x_fill = np.arange(-1, 1, 0.001)
y_fill = norm.pdf(x_fill,0,1)
ax.fill_between(x_fill,y_fill,0, alpha=0.2, color=' green ')

plt.style.use(' Solarize_Light2 ')
plt.show()

U kunt hier de volledige stylesheet-referentiegids voor matplotlib vinden.