Hoe tight_layout() te gebruiken in matplotlib
U kunt de functie Tight_layout() in Matplotlib gebruiken om de opvulling tussen en rond subplots automatisch aan te passen.
Het volgende voorbeeld laat zien hoe u deze functie in de praktijk kunt gebruiken.
Voorbeeld: hoe u Tight_layout() in Matplotlib gebruikt
Stel dat we Matplotilb gebruiken om vier subplots in een 2×2 raster te maken:
 import matplotlib. pyplot as plt

#define data
x = [1, 2, 3]
y = [7, 13, 24]

#define layout for subplots
fig, ax = plt. subplots (2, 2)

#define subplot titles
ax[0, 0]. plot (x,y,color=' red ')
ax[0, 1]. plot (x,y,color=' blue ')
ax[1, 0]. plot (x,y,color=' green ')
ax[1, 1]. plot (x,y,color=' purple ')

#add title to each subplot
ax[0, 0]. set_title (' First Subplot ')
ax[0, 1]. set_title (' Second Subplot ')
ax[1, 0]. set_title (' Third Subplot ')
ax[1, 1]. set_title (' Fourth Subplot ')

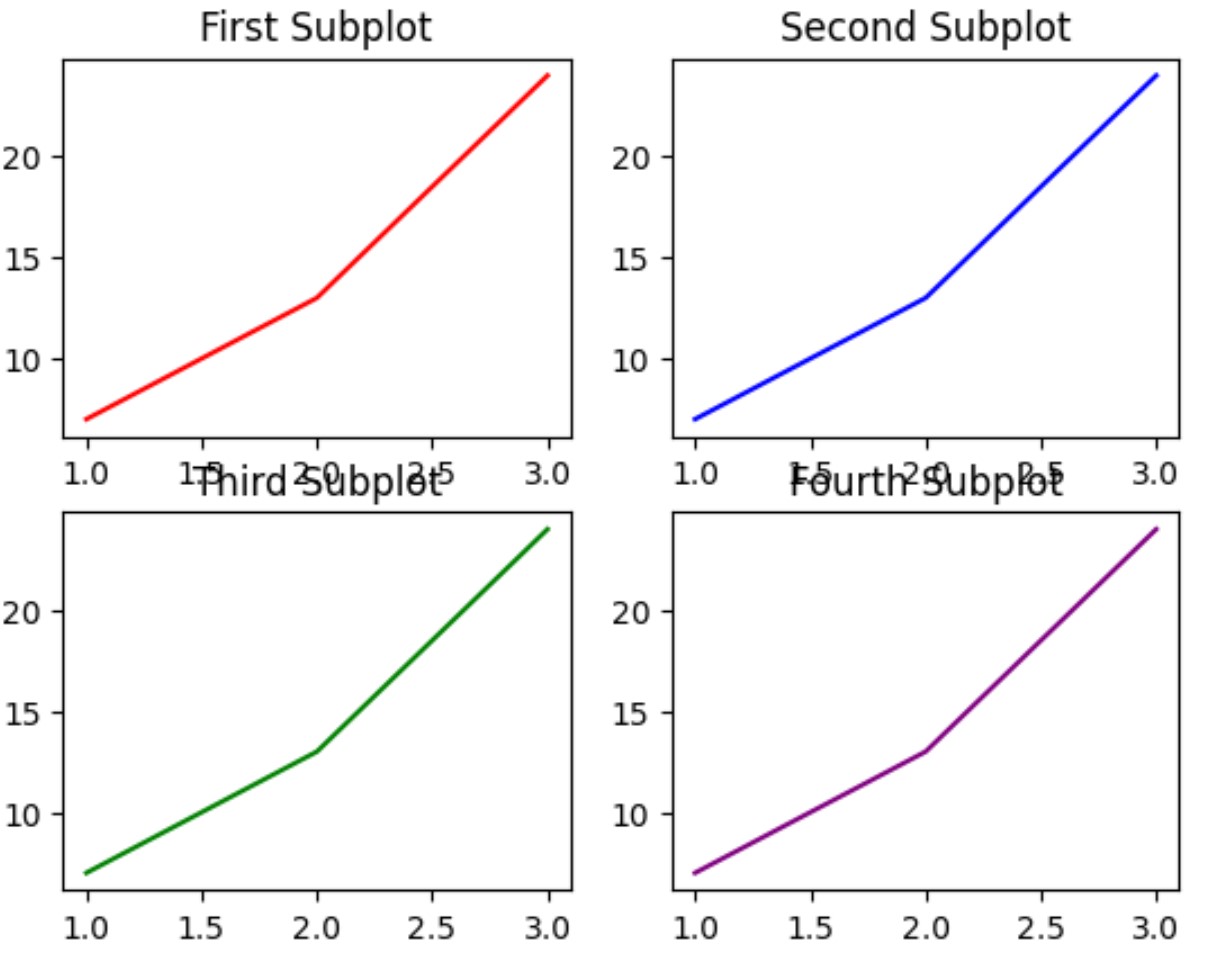
Houd er rekening mee dat er minimale opvulling is tussen subplots, waardoor titels op sommige plaatsen overlappen.
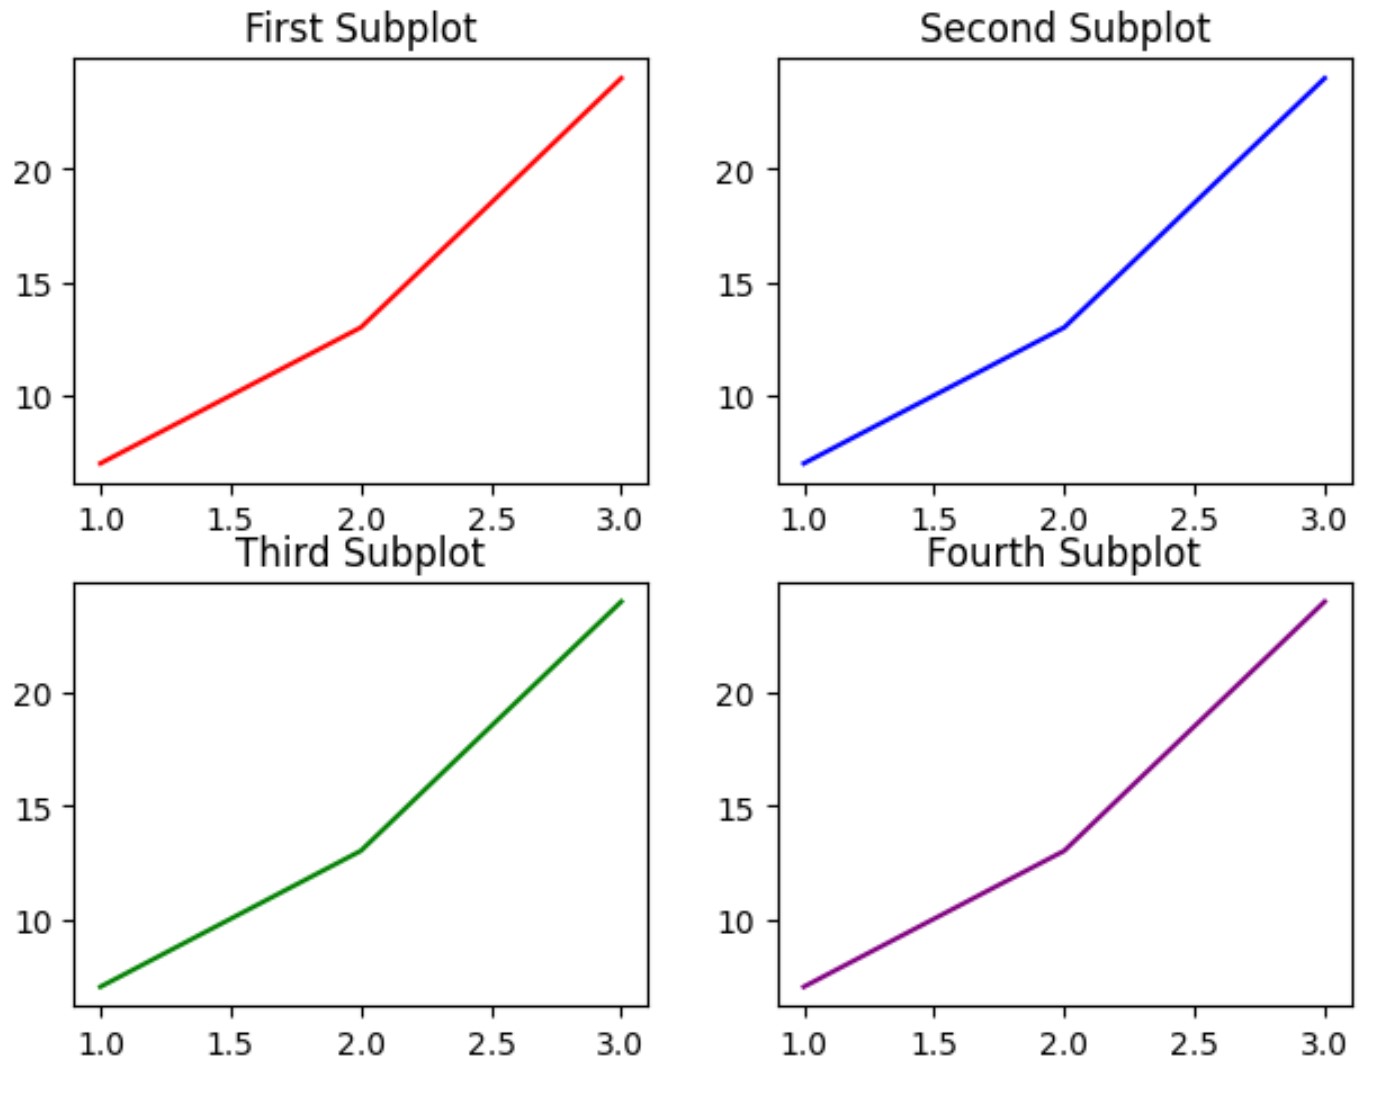
Door fig.tight_layout() op te geven, kunnen we automatisch de opvulling tussen en rond subplots aanpassen:
 import matplotlib. pyplot as plt

#define data
x = [1, 2, 3]
y = [7, 13, 24]

#define layout for subplots
fig, ax = plt. subplots (2, 2)

#specify a tight layout
fig. tight_layout ()

#define subplot titles
ax[0, 0]. plot (x,y,color=' red ')
ax[0, 1]. plot (x,y,color=' blue ')
ax[1, 0]. plot (x,y,color=' green ')
ax[1, 1]. plot (x,y,color=' purple ')

#add title to each subplot
ax[0, 0]. set_title (' First Subplot ')
ax[0, 1]. set_title (' Second Subplot ')
ax[1, 0]. set_title (' Third Subplot ')
ax[1, 1]. set_title (' Fourth Subplot ')

Merk op dat de opvulling tussen en rond subplots is aangepast, zodat plots elkaar in geen enkel gebied meer overlappen.
Houd er rekening mee dat de functie Tight_layout() een pad- argument gebruikt om de opvulling tussen de figuurrand en de subpadranden op te geven, als een fractie van de lettergrootte.
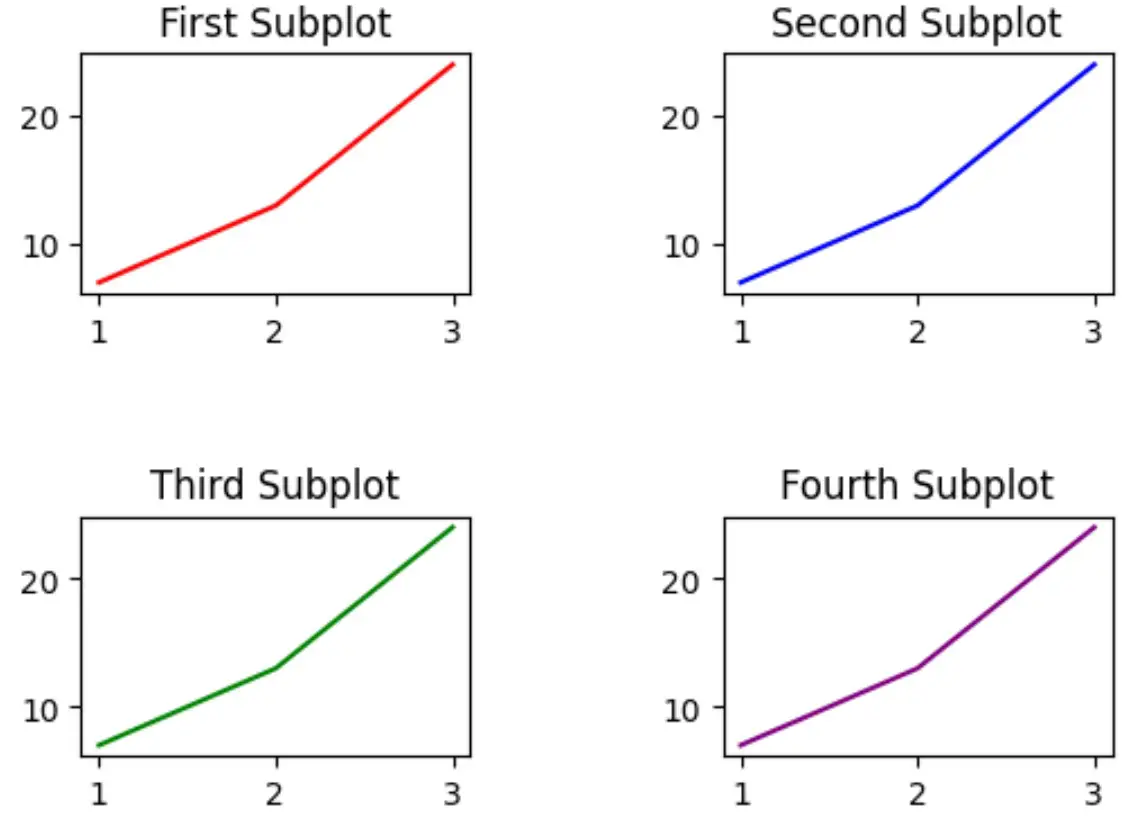
De standaardpadwaarde is 1,08 . We kunnen deze waarde echter verhogen om de opvulling rond de paden te vergroten:
 import matplotlib. pyplot as plt

#define data
x = [1, 2, 3]
y = [7, 13, 24]

#define layout for subplots
fig, ax = plt. subplots (2, 2)

#specify a tight layout with increased padding
fig. tight_layout (pad=5)

#define subplot titles
ax[0, 0]. plot (x,y,color=' red ')
ax[0, 1]. plot (x,y,color=' blue ')
ax[1, 0]. plot (x,y,color=' green ')
ax[1, 1]. plot (x,y,color=' purple ')

#add title to each subplot
ax[0, 0]. set_title (' First Subplot ')
ax[0, 1]. set_title (' Second Subplot ')
ax[1, 0]. set_title (' Third Subplot ')
ax[1, 1]. set_title (' Fourth Subplot ')

Merk op dat de invulling rondom de percelen merkbaar is toegenomen.
Voel je vrij om de waarde van het pad- argument aan te passen om de opvulling rond de paden zoveel te vergroten als je wilt.
Aanvullende bronnen
In de volgende tutorials wordt uitgelegd hoe u andere veelvoorkomende taken in Matplotlib kunt uitvoeren:
Hoe u een titel aan subplots in Matplotlib toevoegt
Hoe de subplotgrootte in Matplotlib aan te passen
Hoe u de afstand tussen Matplotlib-subplots kunt aanpassen