Hoe aslimieten te krijgen in matplotlib (met voorbeeld)
U kunt de volgende syntaxis gebruiken om aslimieten te verkrijgen voor de x- en y-assen van een plot in Matplotlib:
 import matplotlib. pyplot as plt

#get x-axis and y-axis limits
xmin, xmax, ymin, ymax = plt. axis ()

#print axis limits
print (xmin, xmax, ymin, ymax)
Het volgende voorbeeld laat zien hoe u deze syntaxis in de praktijk kunt gebruiken.
Voorbeeld: hoe u aslimieten kunt verkrijgen in Matplotlib
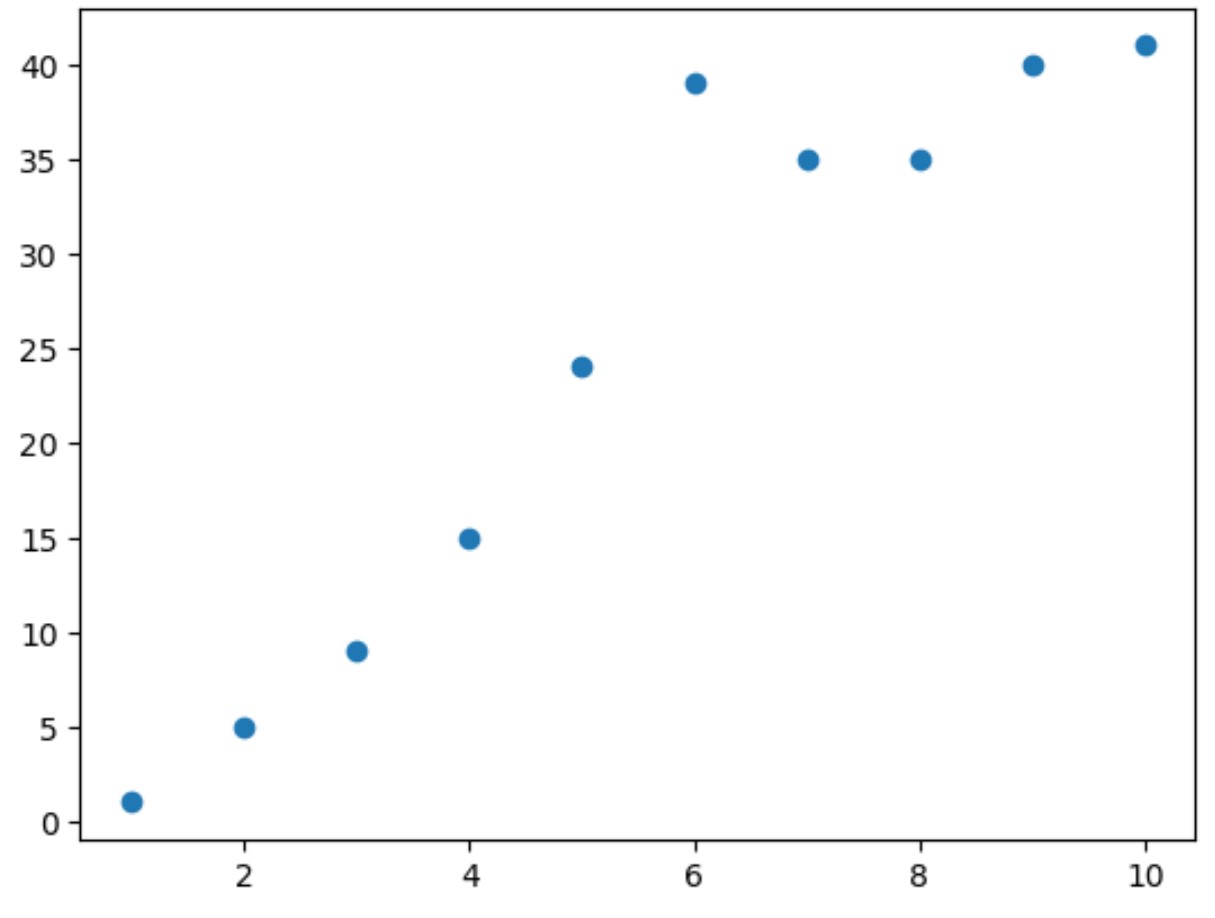
Stel dat we het volgende spreidingsdiagram in Matplotlib maken:
 import matplotlib. pyplot as plt

#define x and y
x = [1, 2, 3, 4, 5, 6, 7, 8, 9, 10]
y = [1, 5, 9, 15, 24, 39, 35, 35, 40, 41]

#create scatter plot of x vs. y
plt. scatter (x,y)

We kunnen de volgende syntaxis gebruiken om de aslimieten voor de x- en y-assen van het spreidingsdiagram te verkrijgen:
 import matplotlib. pyplot as plt

#define x and y
x = [1, 2, 3, 4, 5, 6, 7, 8, 9, 10]
y = [1, 5, 9, 15, 24, 39, 35, 35, 40, 41]

#create scatter plot of x vs. y
plt. scatter (x,y)

#get x-axis and y-axis limits
xmin, xmax, ymin, ymax = plt. axis ()

#print axis limits
print (xmin, xmax, ymin, ymax)

0.55 10.45 -1.0 43.0
Uit het resultaat kunnen we zien:
- Minimum op x-as: 0,55
- Maximaal op x-as: 10,45
- Minimum op y-as: -1,0
- Maximaal op y-as: 43,0
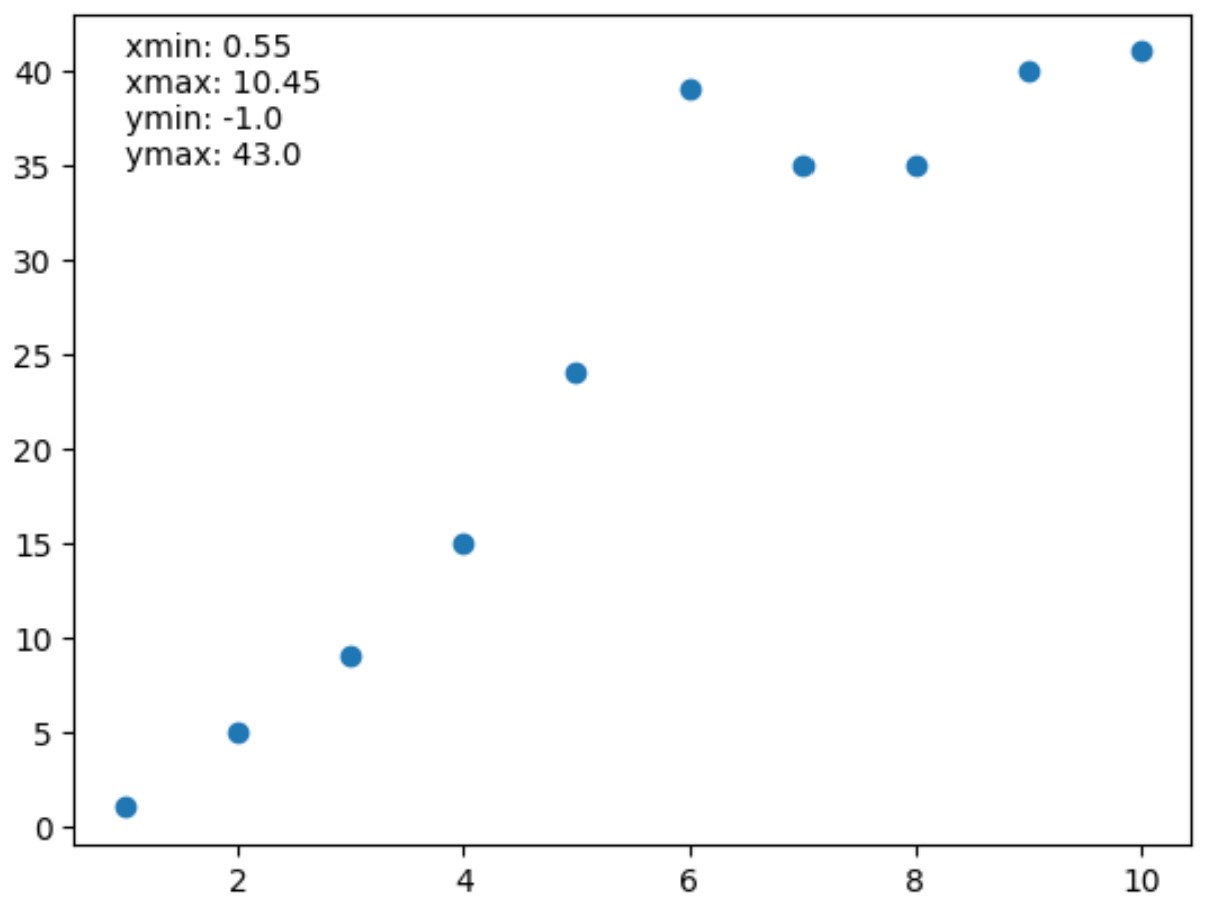
Deze waarden komen overeen met de aslimieten die zichtbaar zijn in het spreidingsdiagram hierboven.
We kunnen ook de functie annotate() gebruiken om deze aslimieten als tekstwaarden aan de plot toe te voegen als we dat willen:
 import matplotlib. pyplot as plt

#define x and y
x = [1, 2, 3, 4, 5, 6, 7, 8, 9, 10]
y = [1, 5, 9, 15, 24, 39, 35, 35, 40, 41]

#create scatter plot of x vs. y
plt. scatter (x,y)

#get x-axis and y-axis limits
xmin, xmax, ymin, ymax = plt. axis ()

#print axis limits
lims = ' xmin: ' + str(round(xmin, 2 )) + ' \n ' + \
       ' xmax: ' + str(round(xmax, 2 )) + ' \n ' + \
       ' ymin: ' + str(round(ymin, 2 )) + ' \n ' + \
       ' ymax: ' + str(round(ymax, 2 ))

#add axis limits to plot at (x,y) coordinate (1.35)
plt. annotate (lims, ( 1 , 35 ))

Aanvullende bronnen
In de volgende tutorials wordt uitgelegd hoe u andere veelvoorkomende taken in Matplotlib kunt uitvoeren:
Hoe u astikken in Matplotlib instelt
Hoe de plotgrootte in Matplotlib te vergroten
Tekst toevoegen aan Matplotlib-plots