Hoe de subplotgrootte in matplotlib aan te passen
U kunt de volgende syntaxis gebruiken om de grootte van subplots in Matplotlib aan te passen:
 #specify one size for all subplots
fig, ax = plt. subplots (2, 2, figsize=(10,7))

#specify individual sizes for subplots
fig, ax = plt. subplots (1, 2, gridspec_kw={' width_ratios ': [3, 1]})
De volgende voorbeelden laten zien hoe u deze syntaxis in de praktijk kunt gebruiken.
Voorbeeld 1: Geef een grootte op voor alle subplots
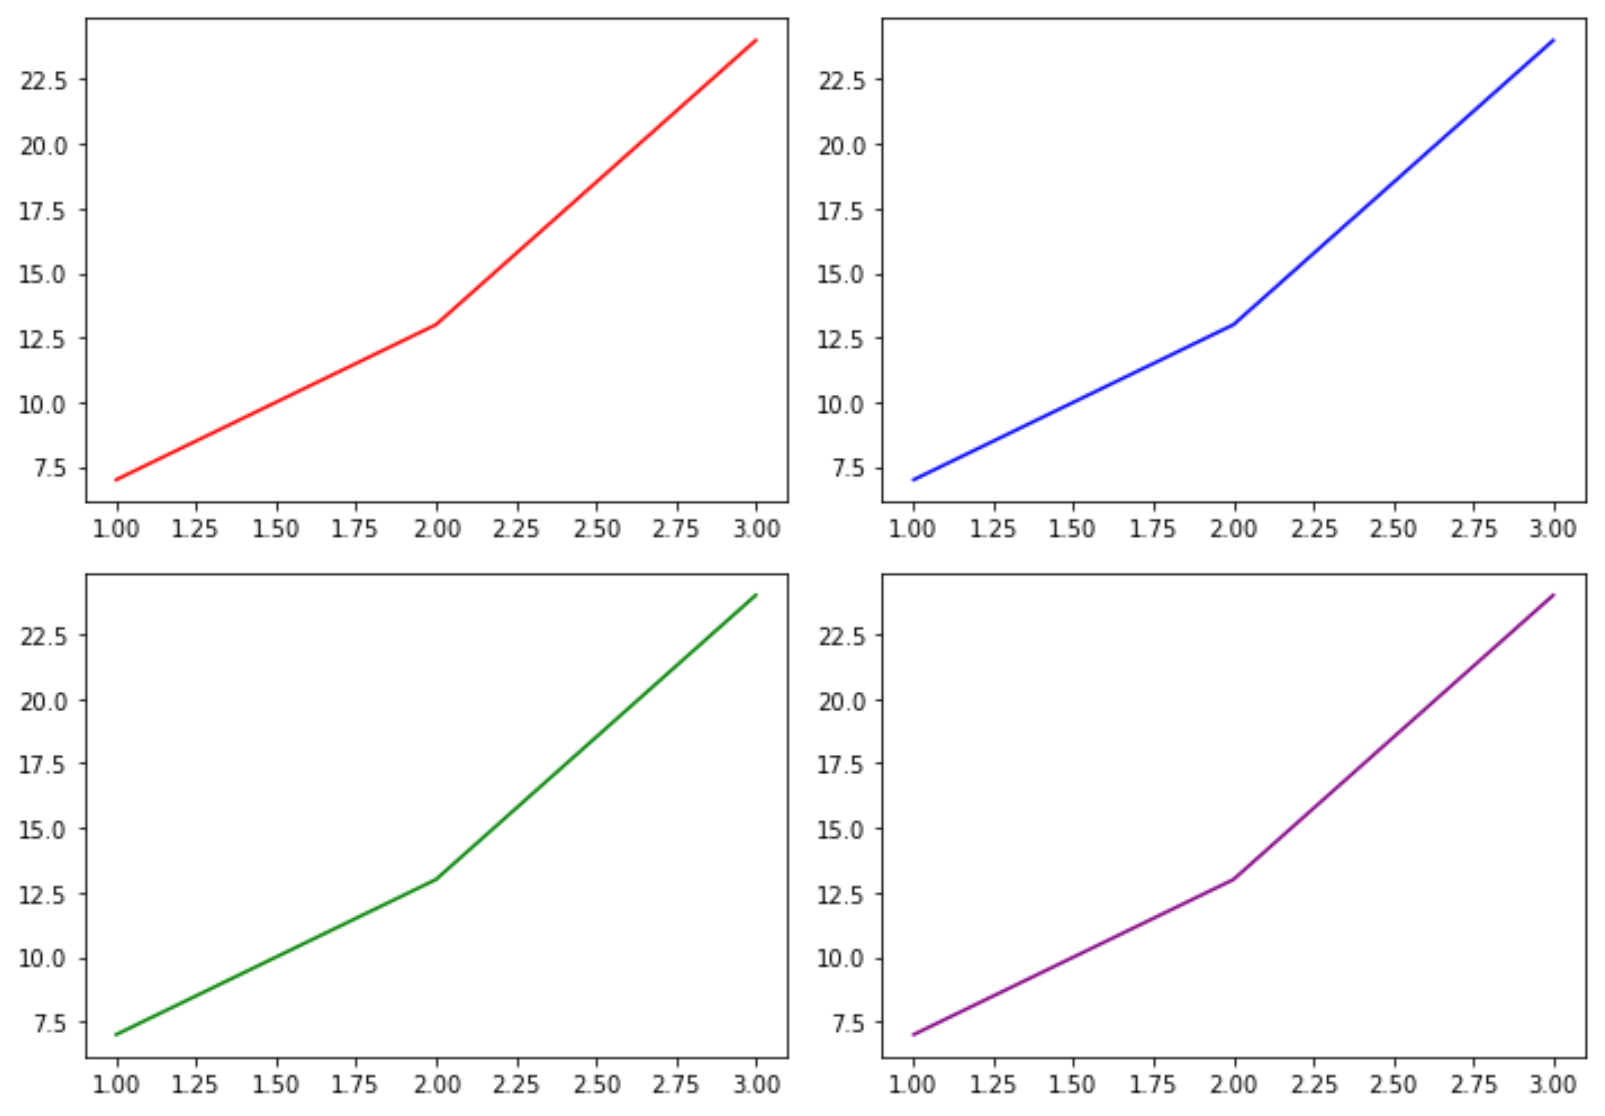
De volgende code laat zien hoe u een grootte voor alle subplots opgeeft:
 import matplotlib. pyplot as plt

#define subplots
fig, ax = plt. subplots (2, 2, figsize=(10,7))
fig. tight_layout ()

#define data
x = [1, 2, 3]
y = [7, 13, 24]

#create subplots
ax[0, 0]. plot (x,y,color=' red ')
ax[0, 1]. plot (x,y,color=' blue ')
ax[1, 0]. plot (x,y,color=' green ')
ax[1, 1]. plot (x,y,color=' purple ')

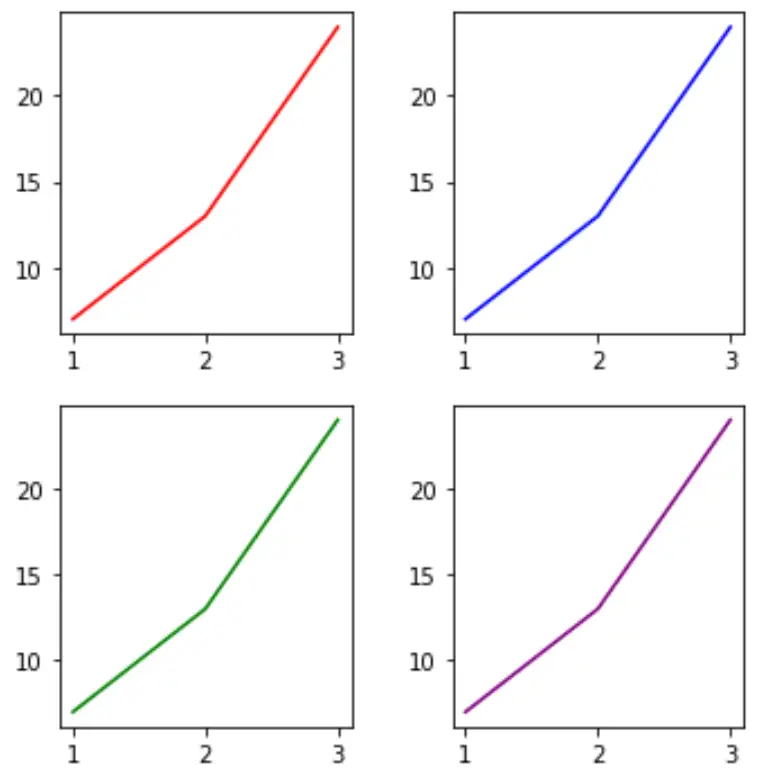
We kunnen de grootte van de aftrekkingen eenvoudig wijzigen door de waarden van het figsize- argument te wijzigen:
 import matplotlib. pyplot as plt

#define subplots
fig, ax = plt. subplots (2, 2, figsize=(5,5))
fig. tight_layout ()

#define data
x = [1, 2, 3]
y = [7, 13, 24]

#create subplots
ax[0, 0]. plot (x,y,color=' red ')
ax[0, 1]. plot (x,y,color=' blue ')
ax[1, 0]. plot (x,y,color=' green ')
ax[1, 1]. plot (x,y,color=' purple ')

Voorbeeld 2: Specificeer de grootte van individuele subplots
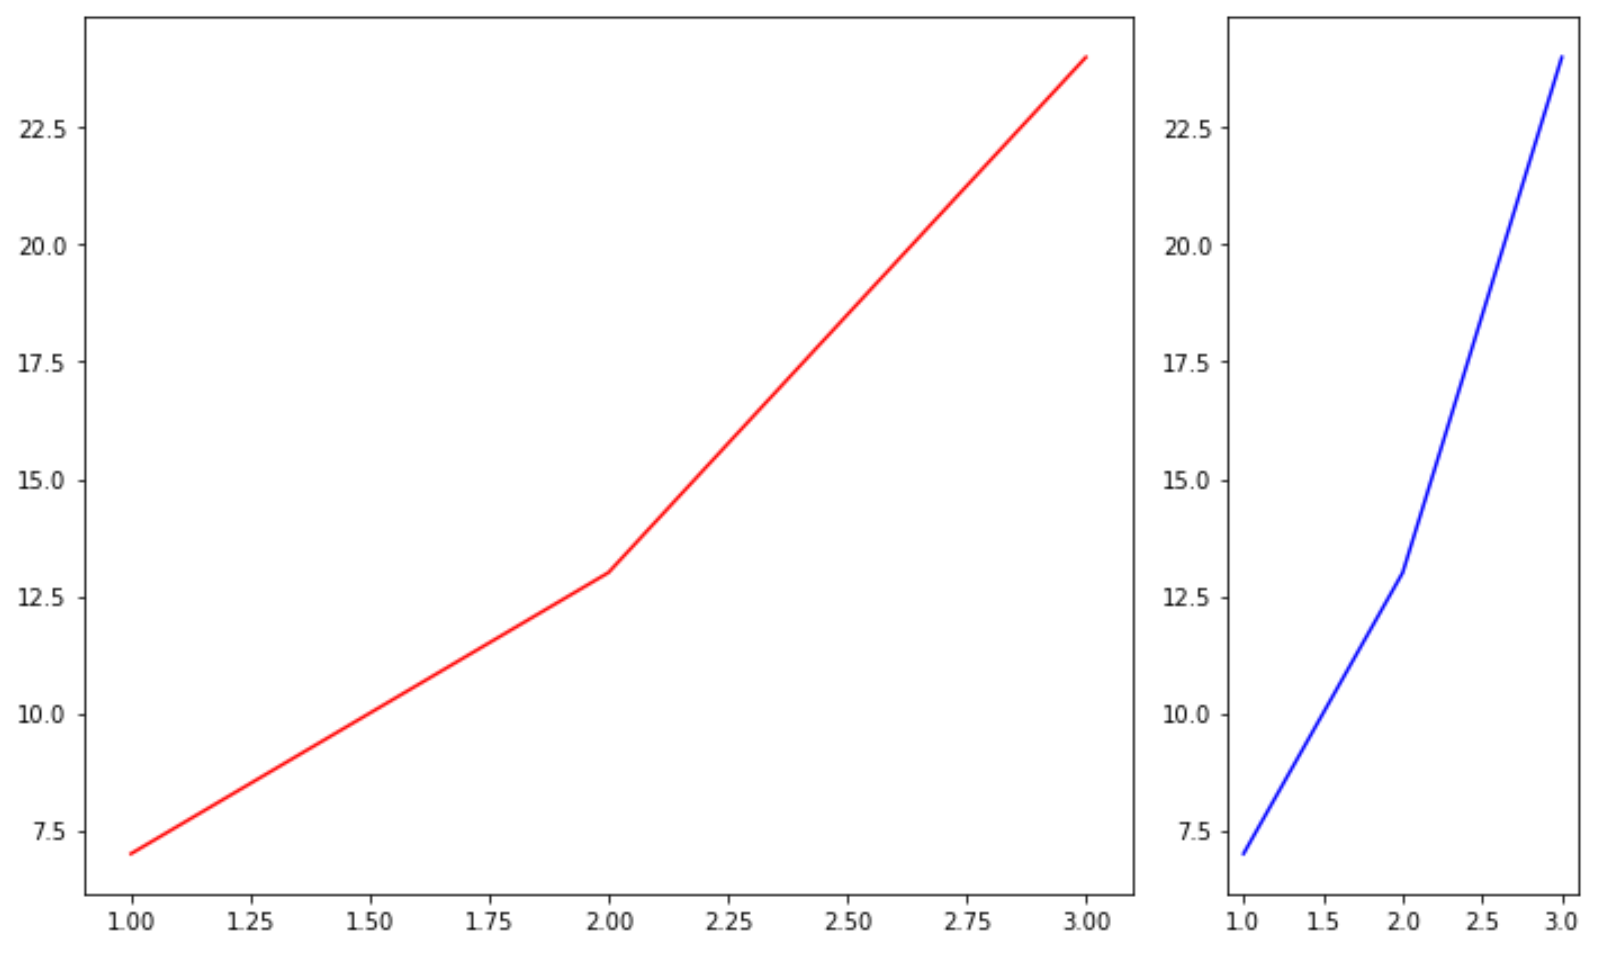
De volgende code laat zien hoe u verschillende formaten voor afzonderlijke subplots kunt opgeven:
 import matplotlib. pyplot as plt

#define subplots
fig, ax = plt. subplots (1, 2, gridspec_kw={' width_ratios ': [3, 1]})
fig. tight_layout ()

#define data
x = [1, 2, 3]
y = [7, 13, 24]

#create subplots
ax[0]. plot (x,y,color=' red ')
ax[1]. plot (x,y,color=' blue ')

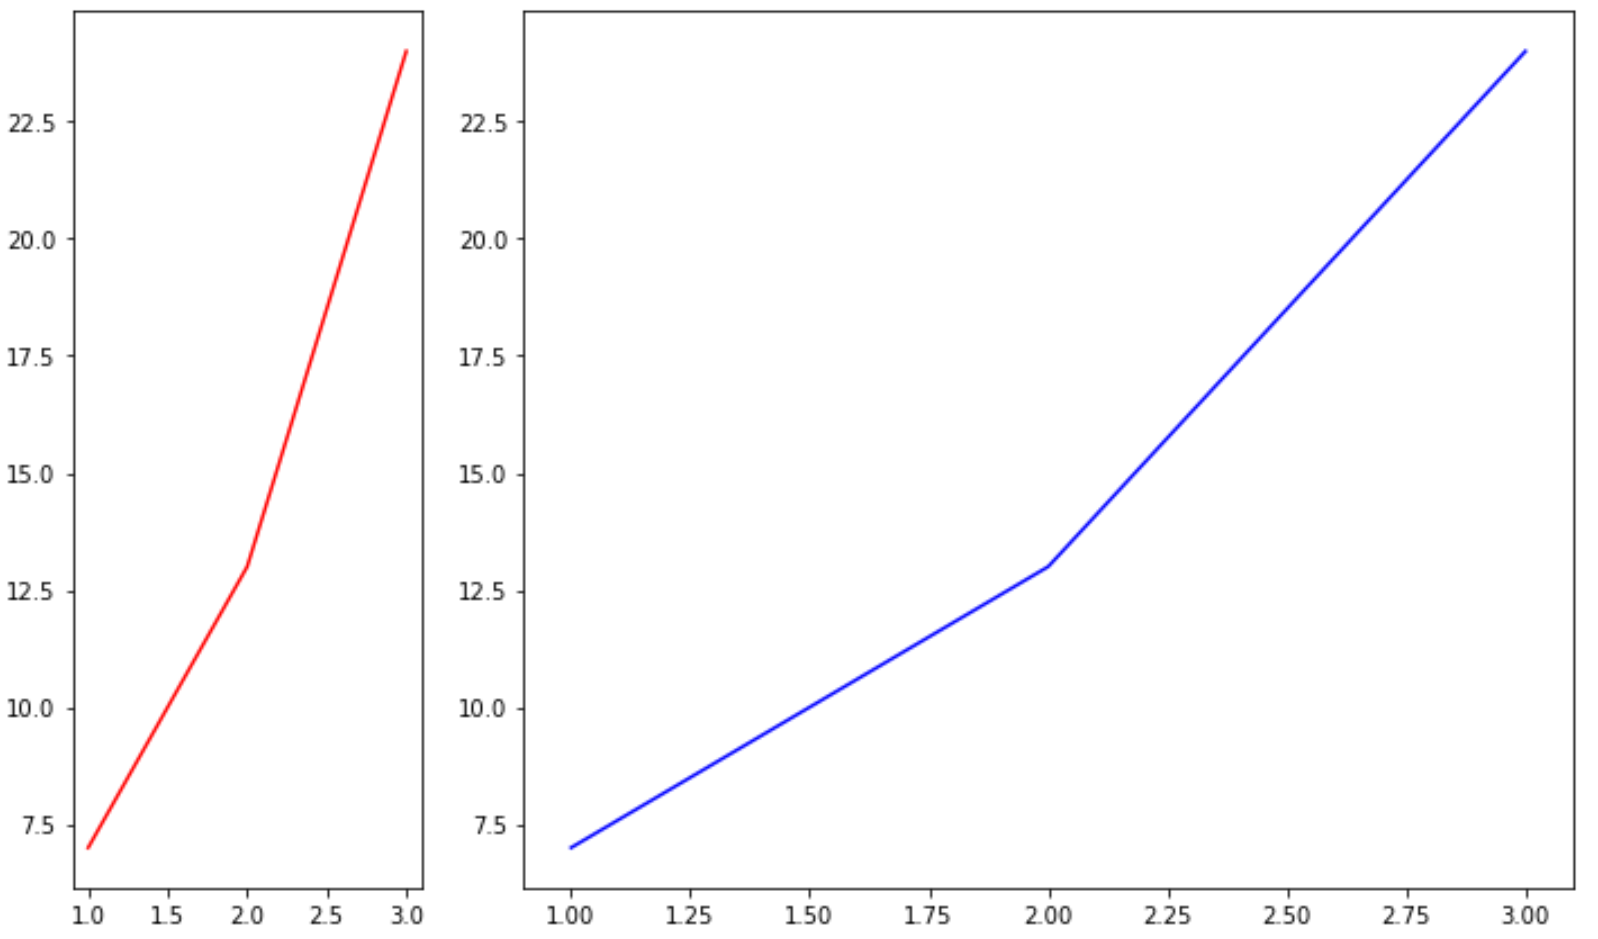
We kunnen de grootte van de aftrekkingen eenvoudig wijzigen door de waarden in het width_ratios- argument te wijzigen:
 import matplotlib. pyplot as plt

#define subplots
fig, ax = plt. subplots (1, 2, gridspec_kw={' width_ratios ': [1, 3]})
fig. tight_layout ()

#define data
x = [1, 2, 3]
y = [7, 13, 24]

#create subplots
ax[0]. plot (x,y,color=' red ')
ax[1]. plot (x,y,color=' blue ')

Aanvullende bronnen
Hoe titels aan plots in Matplotlib toe te voegen
Hoe asbereiken in Matplotlib in te stellen
Hoe X-aswaarden in Matplotlib in te stellen