Een trendlijn toevoegen in matplotlib (met voorbeeld)
U kunt de volgende basissyntaxis gebruiken om een trendlijn toe te voegen aan een plot in Matplotlib:
 #create scatterplot
plt. scatter (x,y)

#calculate equation for trendline
z = np. polyfit (x, y, 1)
p = np. poly1d (z)

#add trendline to plot
plt. plot (x, p(x))
De volgende voorbeelden laten zien hoe u deze syntaxis in de praktijk kunt gebruiken.
Voorbeeld 1: Maak een lineaire trendlijn in Matplotlib
De volgende code laat zien hoe u een basistrendlijn voor een spreidingsdiagram in Matplotlib maakt:
 import numpy as np
import matplotlib. pyplot as plt

#define data
x = np. array ([8, 13, 14, 15, 15, 20, 25, 30, 38, 40])
y = np. array ([5, 4, 18, 14, 20, 24, 28, 33, 30, 37])

#create scatterplot
plt. scatter (x,y)

#calculate equation for trendline
z = np. polyfit (x, y, 1 )
p = np. poly1d (z)

#add trendline to plot
plt. plot (x, p(x))

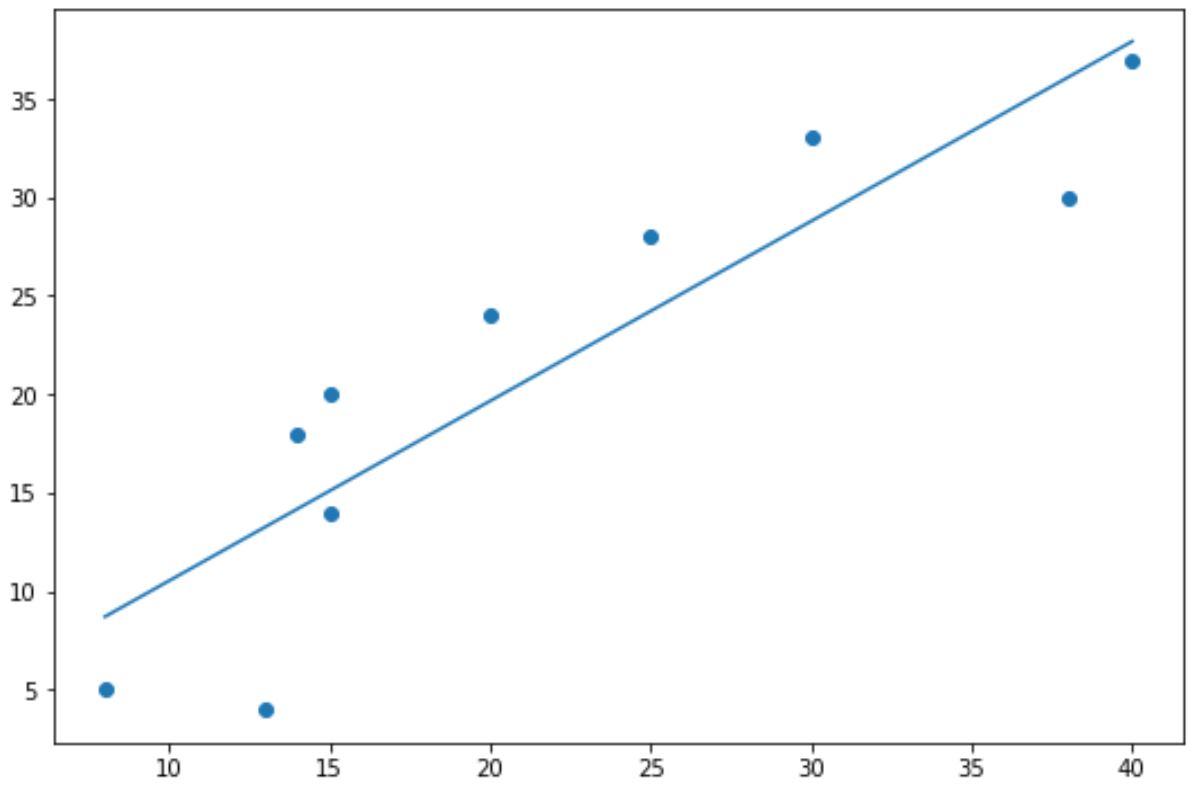
De blauwe stippen vertegenwoordigen de gegevenspunten en de rechte blauwe lijn vertegenwoordigt de lineaire trendlijn.
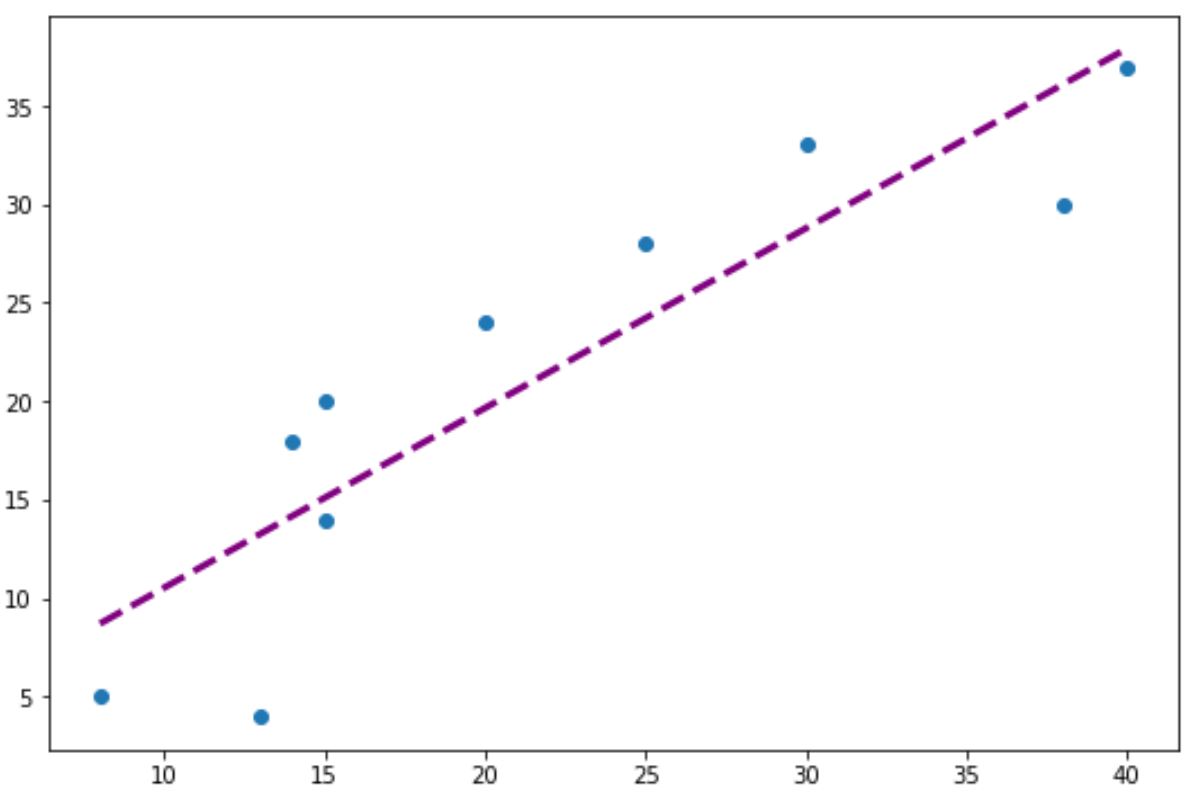
Merk op dat u ook de argumenten color , linewithth en linestyle kunt gebruiken om het uiterlijk van de trendlijn te wijzigen:
 #add custom trendline to plot
plt. plot (x, p(x), color=" purple ", linewidth= 3 , linestyle=" -- ")

Voorbeeld 2: Maak een polynomiale trendlijn in Matplotlib
Om een polynomiale trendlijn te maken, wijzigt u eenvoudigweg de waarde in de functie np.polyfit() .
We kunnen bijvoorbeeld een waarde van 2 gebruiken om een kwadratische trendlijn te creëren:
 import numpy as np
import matplotlib. pyplot as plt

#define data
x = np. array ([8, 13, 14, 15, 15, 20, 25, 30, 38, 40])
y = np. array ([5, 4, 18, 14, 20, 24, 28, 33, 30, 37])

#create scatterplot
plt. scatter (x,y)

#calculate equation for quadratic trendline
z = np. polyfit (x,y, 2 )
p = np. poly1d (z)

#add trendline to plot
plt. plot (x, p(x))

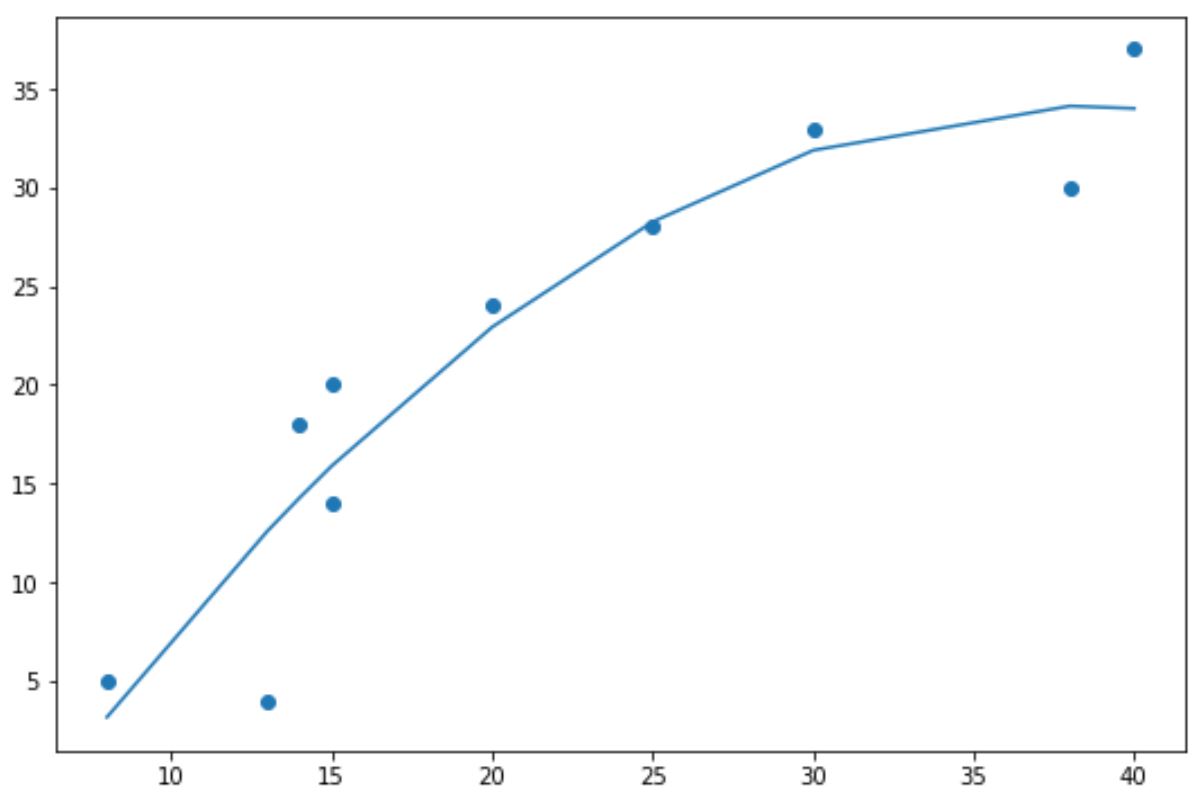
Merk op dat de trendlijn nu gebogen is in plaats van recht.
Deze polynomiale trendlijn is vooral handig wanneer uw gegevens een niet-lineair patroon hebben en een rechte lijn er niet in slaagt de trend van de gegevens adequaat weer te geven.
Aanvullende bronnen
In de volgende tutorials wordt uitgelegd hoe u andere veelvoorkomende functies in Matplotlib kunt uitvoeren:
Hoe assen te verbergen in Matplotlib
Hoe vinkjes in Matplotlib te roteren
Hoe het aantal ticks in Matplotlib te veranderen