Hoe gebieden tussen lijnen in matplotlib te vullen
U kunt het gebied tussen waarden in een Matplotlib-plot eenvoudig vullen met behulp van de volgende functies:
- fill_between() : Vult het gebied tussen twee horizontale curven.
- fill_betweenx() : Vult het gebied tussen twee verticale curven.
Deze tutorial biedt voorbeelden van hoe u elk van deze functies in de praktijk kunt gebruiken.
Voorbeeld 1: Vul het gebied tussen twee horizontale lijnen
De volgende code laat zien hoe u het gebied tussen twee horizontale lijnen vult:
 import matplotlib. pyplot as plt
import numpy as np

#define x and y values
x = np. arange (0,10,0.1)
y = np. arange (10,20,0.1)

#create plot of values
plt. plot (x,y)

#fill in area between the two lines
plt. fill_between (x,y,color=' red ')
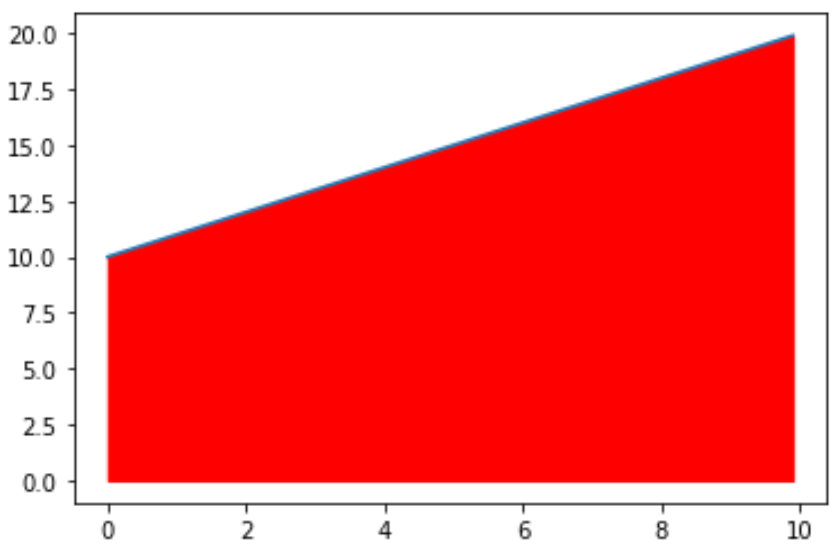
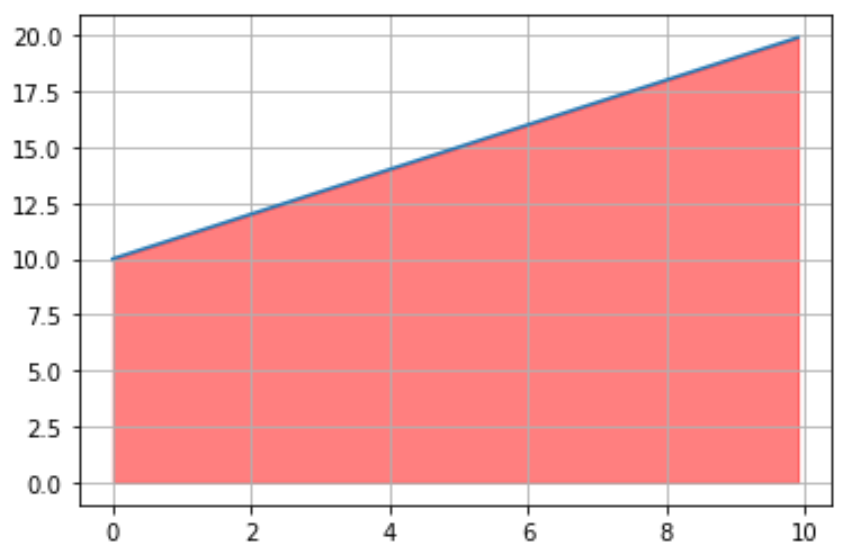
Merk op dat we ook de functie plt.grid() kunnen gebruiken om een raster aan de plot toe te voegen om gemakkelijker te zien welke waarden gevuld zijn:
 import matplotlib. pyplot as plt
import numpy as np

#define x and y values
x = np. arange (0,10,0.1)
y = np. arange (10,20,0.1)

#create plot of values
plt. plot (x,y)

#fill in area between the two lines
plt. fill_between (x, y, color=' red ', alpha= .5 )

#add gridlines
plt. grid ()
Voorbeeld 2: Vul het gebied onder een curve
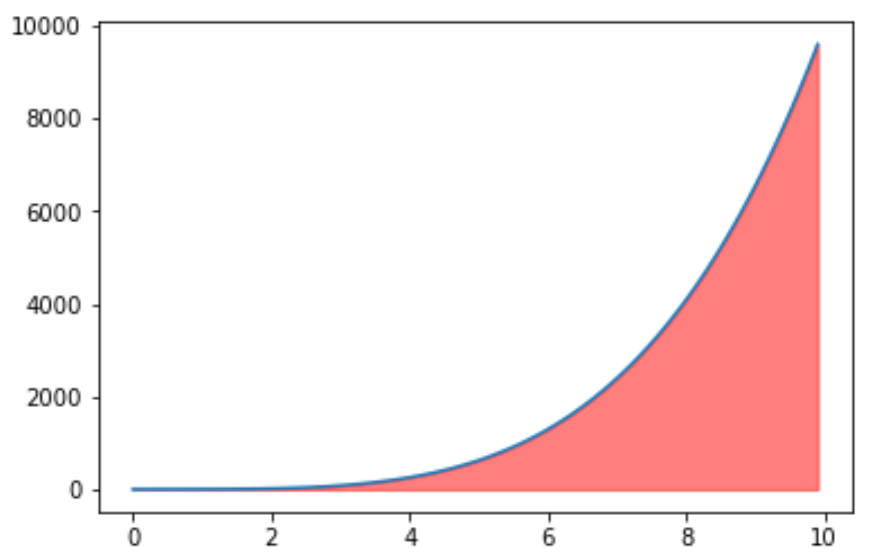
De volgende code laat zien hoe u het gebied onder een curve vult:
 import matplotlib. pyplot as plt
import numpy as np

#define x and y values
x = np. arange (0,10,0.1)
y = x**4

#create plot of values
plt. plot (x,y)

#fill in area between the two lines
plt. fill_between (x, y, color=' red ', alpha= .5 )
Voorbeeld 3: Vul het gebied boven een curve
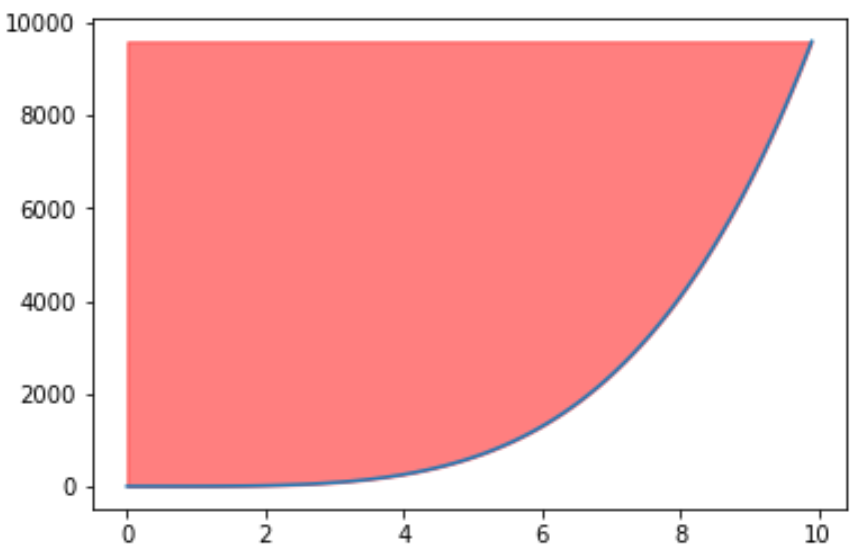
De volgende code laat zien hoe u het gebied boven een curve vult:
 import matplotlib. pyplot as plt
import numpy as np

#define x and y values
x = np. arange (0,10,0.1)
y = x**4

#create plot of values
plt. plot (x,y)

#fill in area between the two lines
plt. fill_between (x, y, np. max (y), color=' red ', alpha= .5 )
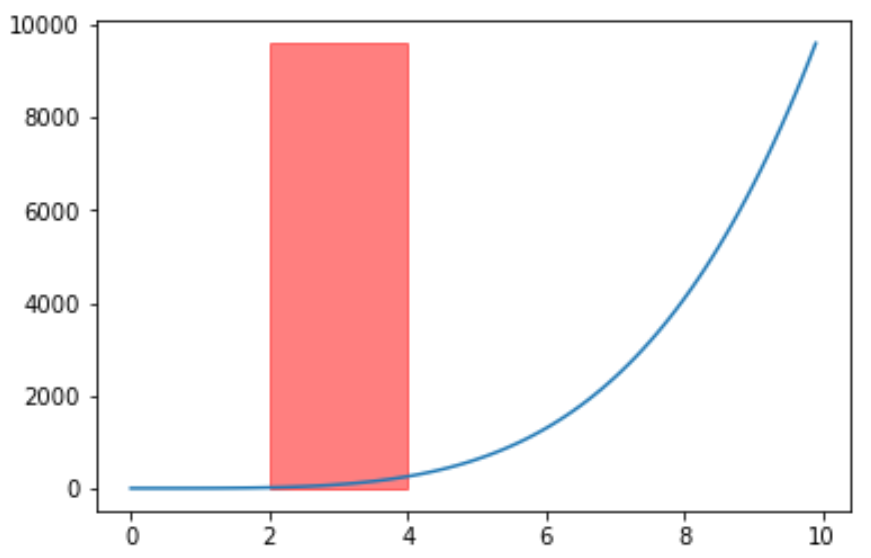
Voorbeeld 4: Vul het gebied tussen twee verticale lijnen
De volgende code laat zien hoe u de functie fill_betweenx() gebruikt om het gebied tussen twee verticale lijnen te vullen:
 import matplotlib. pyplot as plt
import numpy as np

#define x and y values
x = np. arange (0,10,0.1)
y = np. arange (10,20,0.1)

#create plot of values
plt. plot (x,y)

#fill in area between the two lines
plt. fill_betweenx (y, 2, 4, color=' red ', alpha= .5 )
Gerelateerd: Hoe een vloeiende curve in Matplotlib te plotten