Hoe meerdere lijnen in matplotlib te plotten
U kunt meerdere lijnen in één Matplotlib-plot weergeven met behulp van de volgende syntaxis:
 import matplotlib. pyplot as plt

plt. plot (df[' column1 '])
plt. plot (df[' column2 '])
plt. plot (df[' column3 '])

...
plt. show ()
Deze zelfstudie biedt verschillende voorbeelden van hoe u meerdere lijnen in een diagram kunt plotten met behulp van de volgende panda’s DataFrame:
 import numpy as np
import pandas as pd

#make this example reproducible
n.p. random . seeds (0)

#create dataset
period = np. arange (1, 101, 1)
leads = np. random . uniform (1, 50, 100)
prospects = np. random . uniform (40, 80, 100)
sales = 60 + 2*period + np. random . normal (loc=0, scale=.5*period, size=100)
df = pd. DataFrame ({' period ': period,
                   ' leads ': leads,
                   ' prospects ': prospects,
                   ' sales ': sales})

#view first 10 rows
df. head (10)


        period leads sales prospects
0 1 27.891862 67.112661 62.563318
1 2 36.044279 50.800319 62.920068
2 3 30.535405 69.407761 64.278797
3 4 27.699276 78.487542 67.124360
4 5 21.759085 49.950126 68.754919
5 6 32.648812 63.046293 77.788596
6 7 22.441773 63.681677 77.322973
7 8 44.696877 62.890076 76.350205
8 9 48.219475 48.923265 72.485540
9 10 19.788634 78.109960 84.221815
Teken meerdere lijnen in Matplotlib
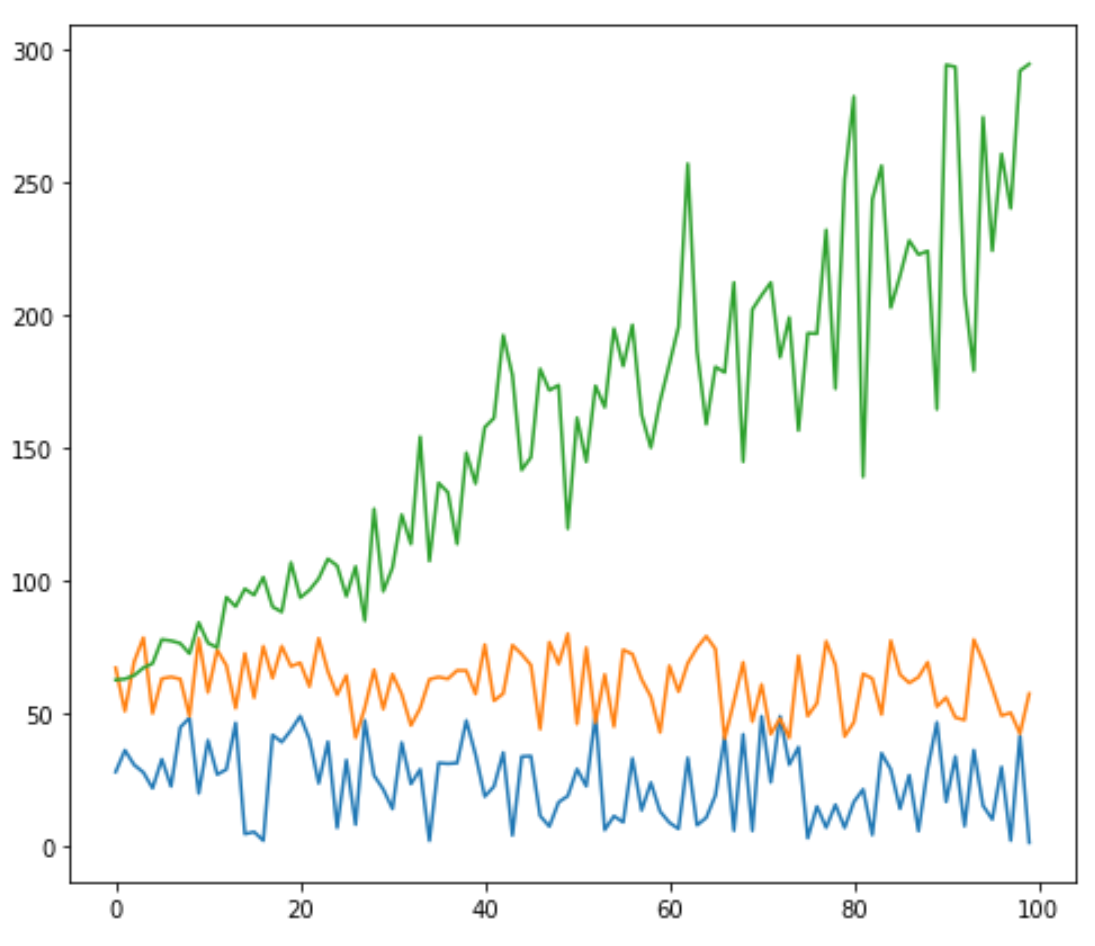
De volgende code laat zien hoe u drie afzonderlijke lijnen in één plot in matplotlib kunt plotten:
 import matplotlib. pyplot as plt

#plot individual lines
plt. plot (df[' leads '])
plt. plot (df[' prospects '])
plt. plot (df[' sales '])

#displayplot
plt. show ()

Pas lijnen aan in Matplotlib
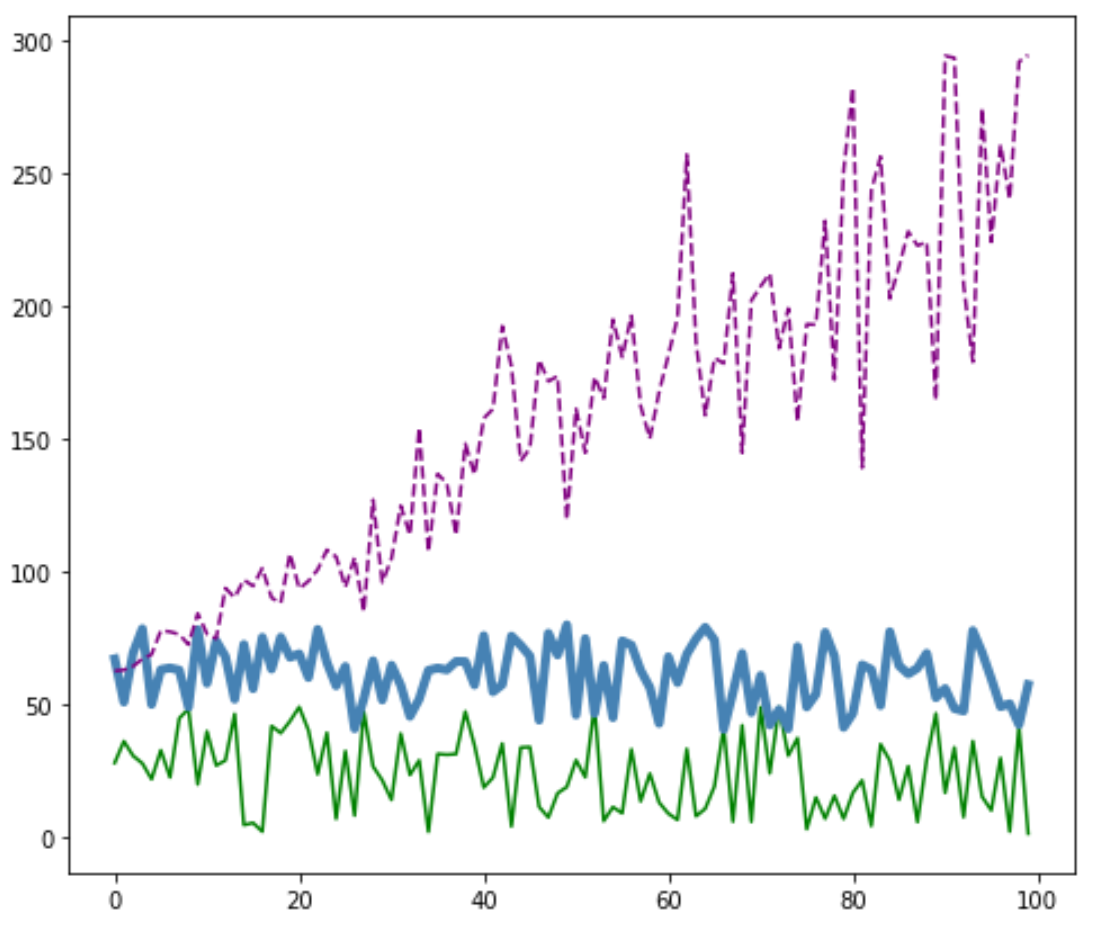
U kunt ook de kleur, stijl en breedte van elke lijn aanpassen:
 #plot individual lines with custom colors, styles, and widths
plt. plot (df[' leads '], color=' green ')
plt. plot (df[' prospects '], color=' steelblue ', linewidth= 4 )
plt. plot (df[' sales '], color=' purple ', linestyle=' dashed ')

#displayplot
plt. show ()

Voeg een legenda toe in Matplotlib
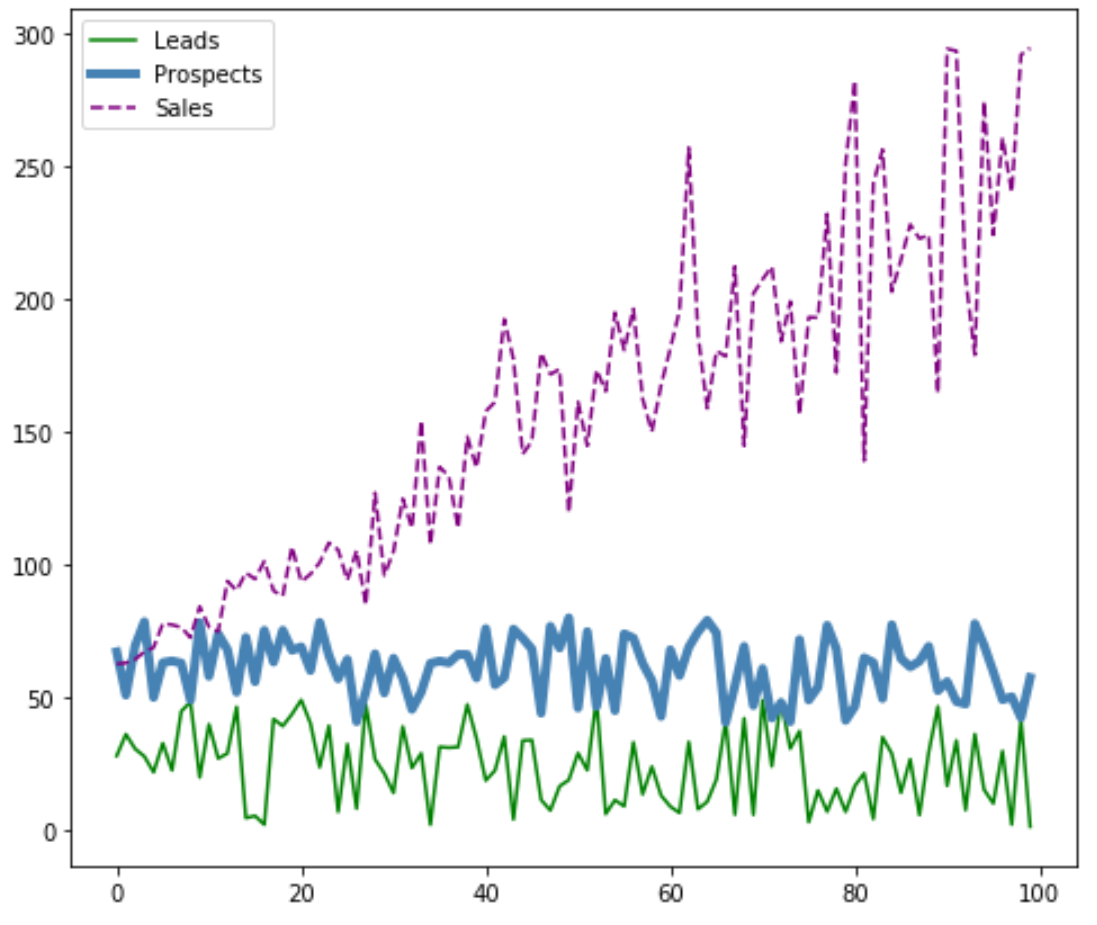
Je kunt ook een bijschrift toevoegen om de lijnen te onderscheiden:
 #plot individual lines with custom colors, styles, and widths
plt. plot (df[' leads '], label=' Leads ', color=' green ')
plt. plot (df[' prospects '], label=' Prospects ', color=' steelblue ', linewidth= 4 )
plt. plot (df[' sales '], label=' Sales ', color=' purple ', linestyle=' dashed ')

#add legend
plt. legend ()

#displayplot
plt. show ()

Voeg aslabels en titels toe in Matplotlib
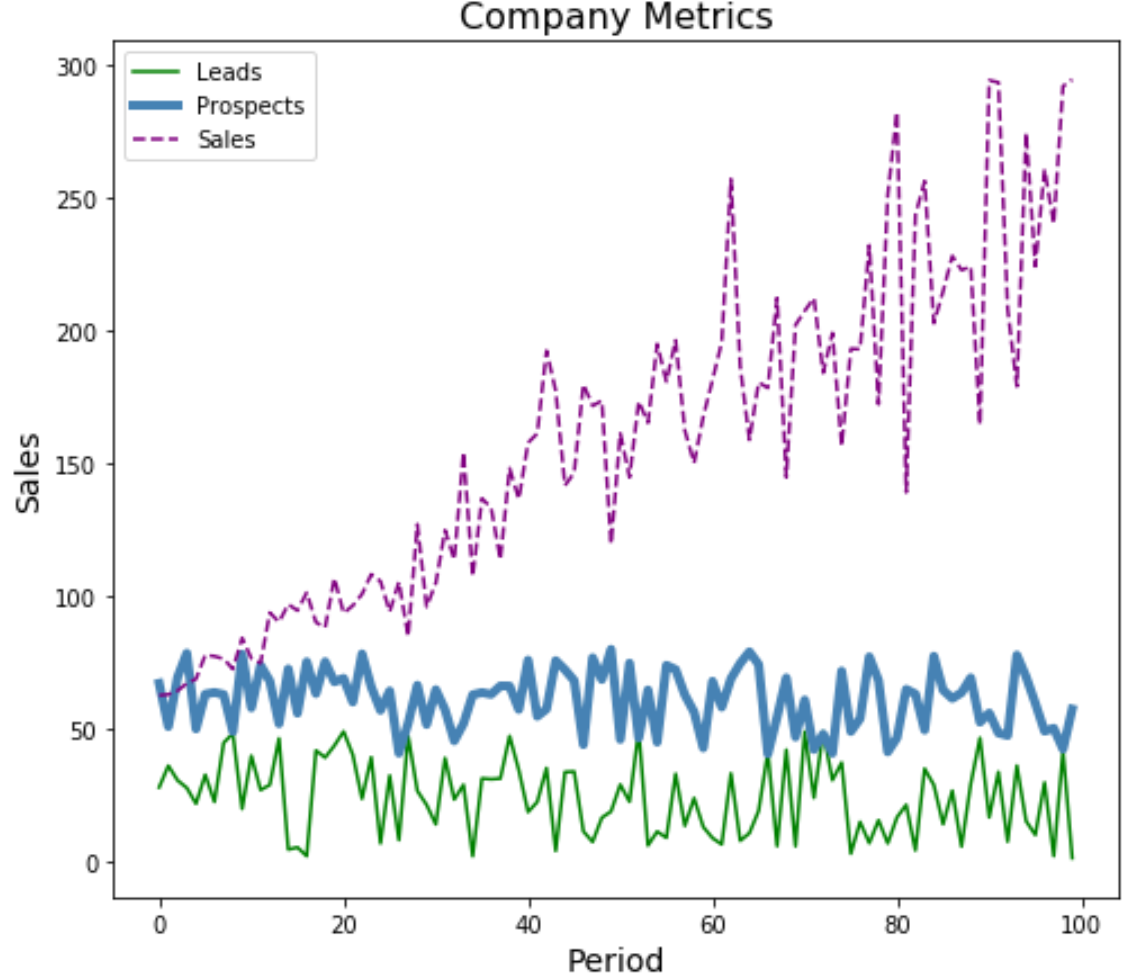
Ten slotte kunt u aslabels en een titel toevoegen om de plot te voltooien:
 #plot individual lines with custom colors, styles, and widths
plt. plot (df[' leads '], label=' Leads ', color=' green ')
plt. plot (df[' prospects '], label=' Prospects ', color=' steelblue ', linewidth= 4 )
plt. plot (df[' sales '], label=' Sales ', color=' purple ', linestyle=' dashed ')

#add legend
plt. legend ()

#add axis labels and a title
plt. ylabel (' Sales ', fontsize= 14 )
plt. xlabel (' Period ', fontsize= 14 )
plt. title (' Company Metrics ', fontsize= 16 )

#displayplot
plt. show ()

Je kunt hier meer Matplotlib-tutorials vinden.