Jak usunąć tytuł legendy w ggplot2
Możesz użyć następującej składni, aby usunąć tytuł legendy z fabuły w ggplot2:
 ggplot(df, aes(x=x_var, y=y_var, color=group_var)) +
  geom_point() +
  labs(color= NULL )
Argument color=NULL w funkcji labs() informuje ggplot2, aby nie wyświetlał żadnych tytułów legend.
Poniższy przykład pokazuje, jak zastosować tę składnię w praktyce.
Przykład: Usuń tytuł z legendy fabuły w ggplot2
Załóżmy, że mamy następującą ramkę danych w R, która zawiera informacje o różnych koszykarzach:
 df <- data. frame (assists=c(3, 4, 4, 3, 1, 5, 6, 7, 9),
                 points=c(14, 8, 8, 16, 3, 7, 17, 22, 26),
                 position=rep(c('Guard', 'Forward', 'Center'), times= 3 ))

#view data frame
df

  assist points position
1 3 14 Guard
2 4 8 Forward
3 4 8 Center
4 3 16 Guard
5 1 3 Forward
6 5 7 Center
7 6 17 Guard
8 7 22 Forward
9 9 26 Center
Jeśli użyjemy geom_point() do utworzenia chmury punktów w ggplot2, wyświetli się legenda z domyślnym tytułem:
 library (ggplot2)

#create scatter plot of assists vs. points, grouped by position
ggplot(df, aes(x=assists, y=points, color=position)) +
  geom_point(size= 3 )
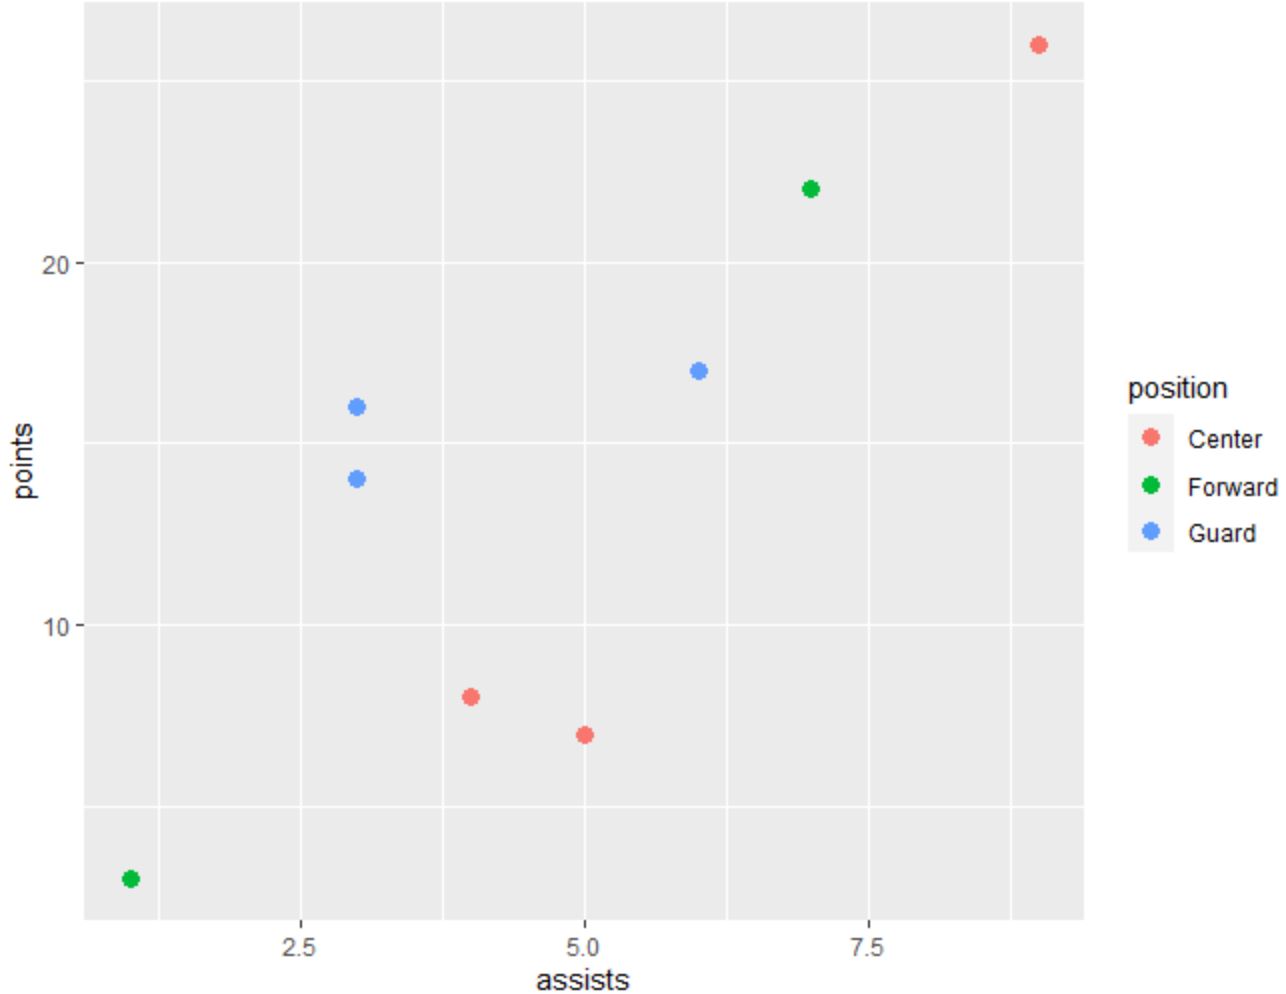
Należy pamiętać, że w tytule legendy wyświetlany jest obecnie tekst „pozycja”.
Aby usunąć ten tytuł z legendy, możemy użyć argumentu labs(color=NULL) :
 library (ggplot2)

#create scatter plot and remove legend title
ggplot(df, aes(x=assists, y=points, color=position)) +
  geom_point(size= 3 ) +
  labs(color= NULL )
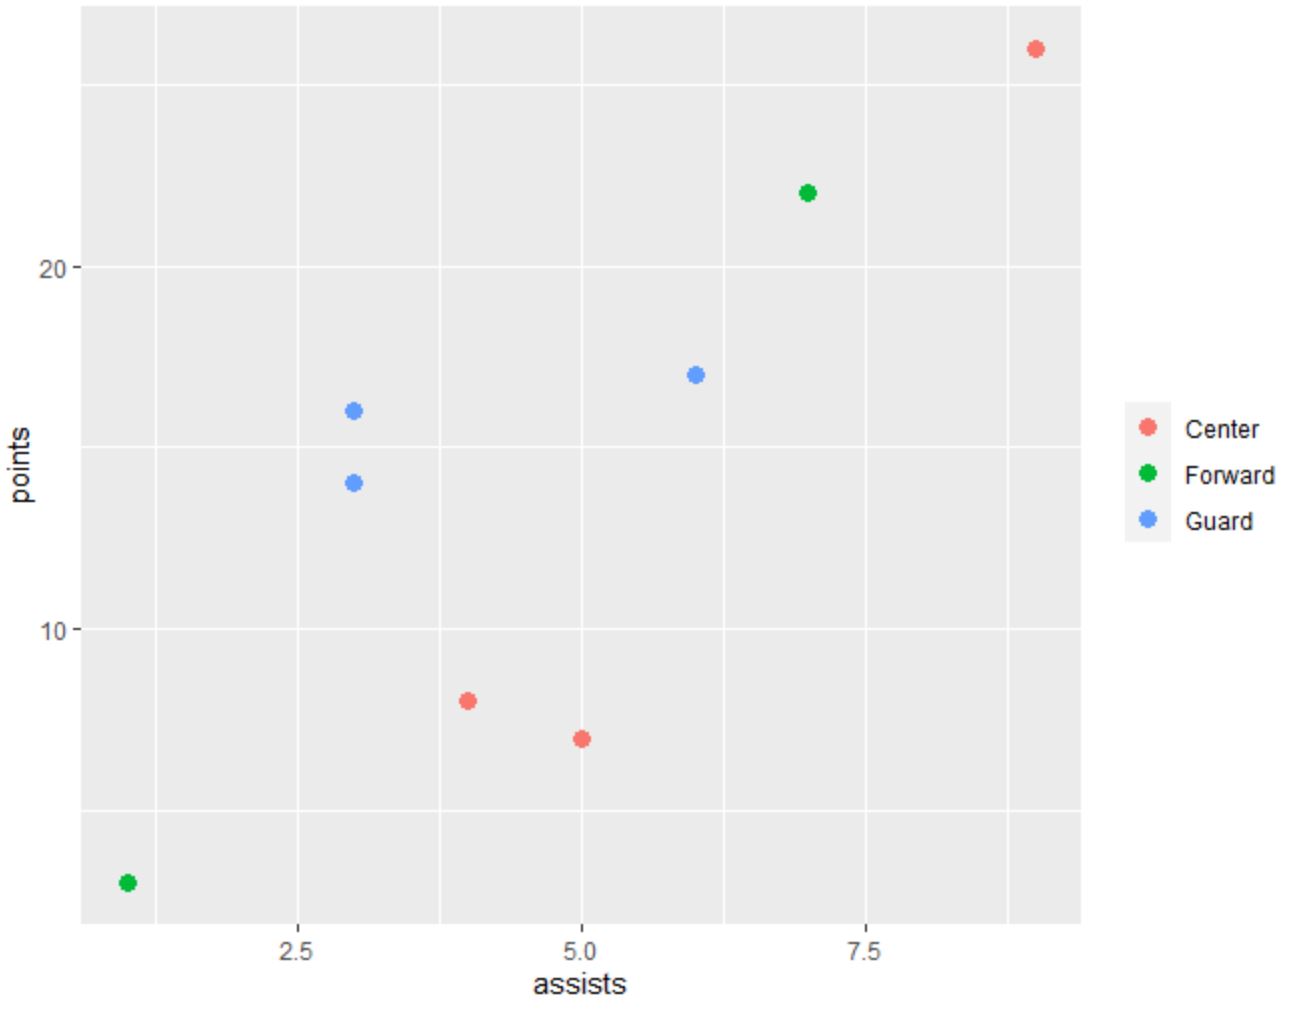
Należy pamiętać, że tytuł podpisu został usunięty.
Dodatkowe zasoby
Poniższe samouczki wyjaśniają, jak wykonywać inne typowe zadania w ggplot2:
Jak zmienić tytuł legendy w ggplot2
Jak zmienić rozmiar legendy w ggplot2
Jak zmienić pozycję legendy w ggplot2
o autorze
Dr Benjamin Anderson
Cześć, jestem Benjamin i jestem emerytowanym profesorem statystyki, który został oddanym nauczycielem Statorials. Dzięki bogatemu doświadczeniu i wiedzy specjalistycznej w dziedzinie statystyki chętnie dzielę się swoją wiedzą, aby wzmocnić pozycję uczniów za pośrednictwem Statorials. Wiedzieć więcej