Como ajustar o tamanho da subparcela no matplotlib
Você pode usar a seguinte sintaxe para ajustar o tamanho das subparcelas no Matplotlib:
 #specify one size for all subplots
fig, ax = plt. subplots (2, 2, figsize=(10,7))

#specify individual sizes for subplots
fig, ax = plt. subplots (1, 2, gridspec_kw={' width_ratios ': [3, 1]})
Os exemplos a seguir mostram como usar essa sintaxe na prática.
Exemplo 1: Especifique um tamanho para todas as subparcelas
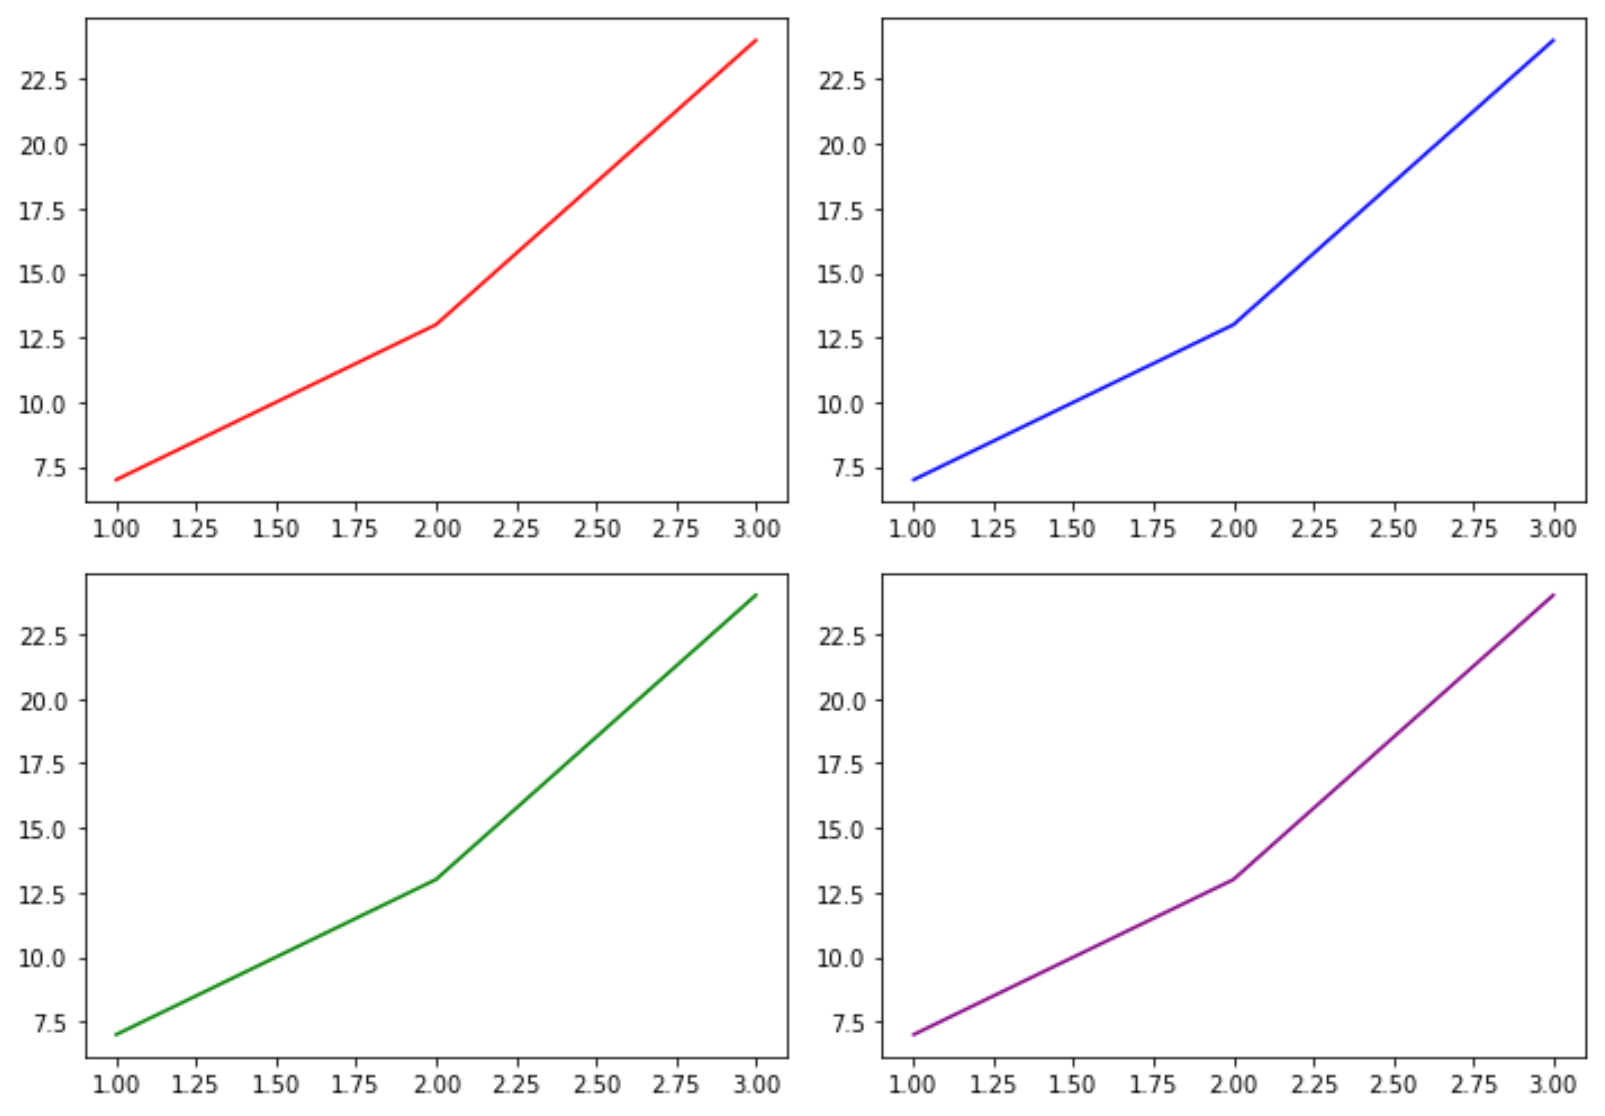
O código a seguir mostra como especificar um tamanho para todas as subtramas:
 import matplotlib. pyplot as plt

#define subplots
fig, ax = plt. subplots (2, 2, figsize=(10,7))
fig. tight_layout ()

#define data
x = [1, 2, 3]
y = [7, 13, 24]

#create subplots
ax[0, 0]. plot (x,y,color=' red ')
ax[0, 1]. plot (x,y,color=' blue ')
ax[1, 0]. plot (x,y,color=' green ')
ax[1, 1]. plot (x,y,color=' purple ')

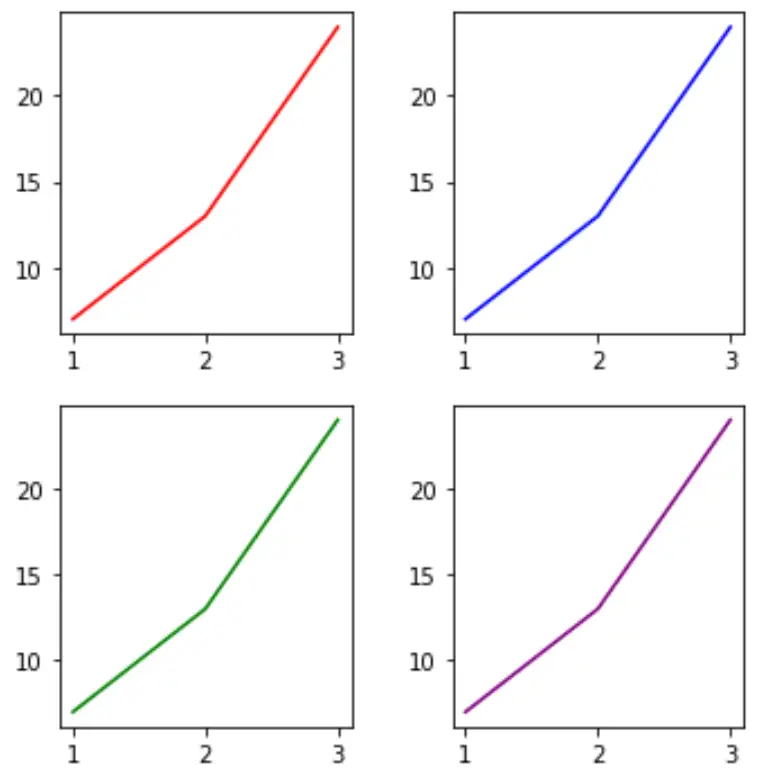
Podemos facilmente alterar o tamanho dos subtraços alterando os valores do argumento figsize :
 import matplotlib. pyplot as plt

#define subplots
fig, ax = plt. subplots (2, 2, figsize=(5,5))
fig. tight_layout ()

#define data
x = [1, 2, 3]
y = [7, 13, 24]

#create subplots
ax[0, 0]. plot (x,y,color=' red ')
ax[0, 1]. plot (x,y,color=' blue ')
ax[1, 0]. plot (x,y,color=' green ')
ax[1, 1]. plot (x,y,color=' purple ')

Exemplo 2: Especifique os tamanhos de subparcelas individuais
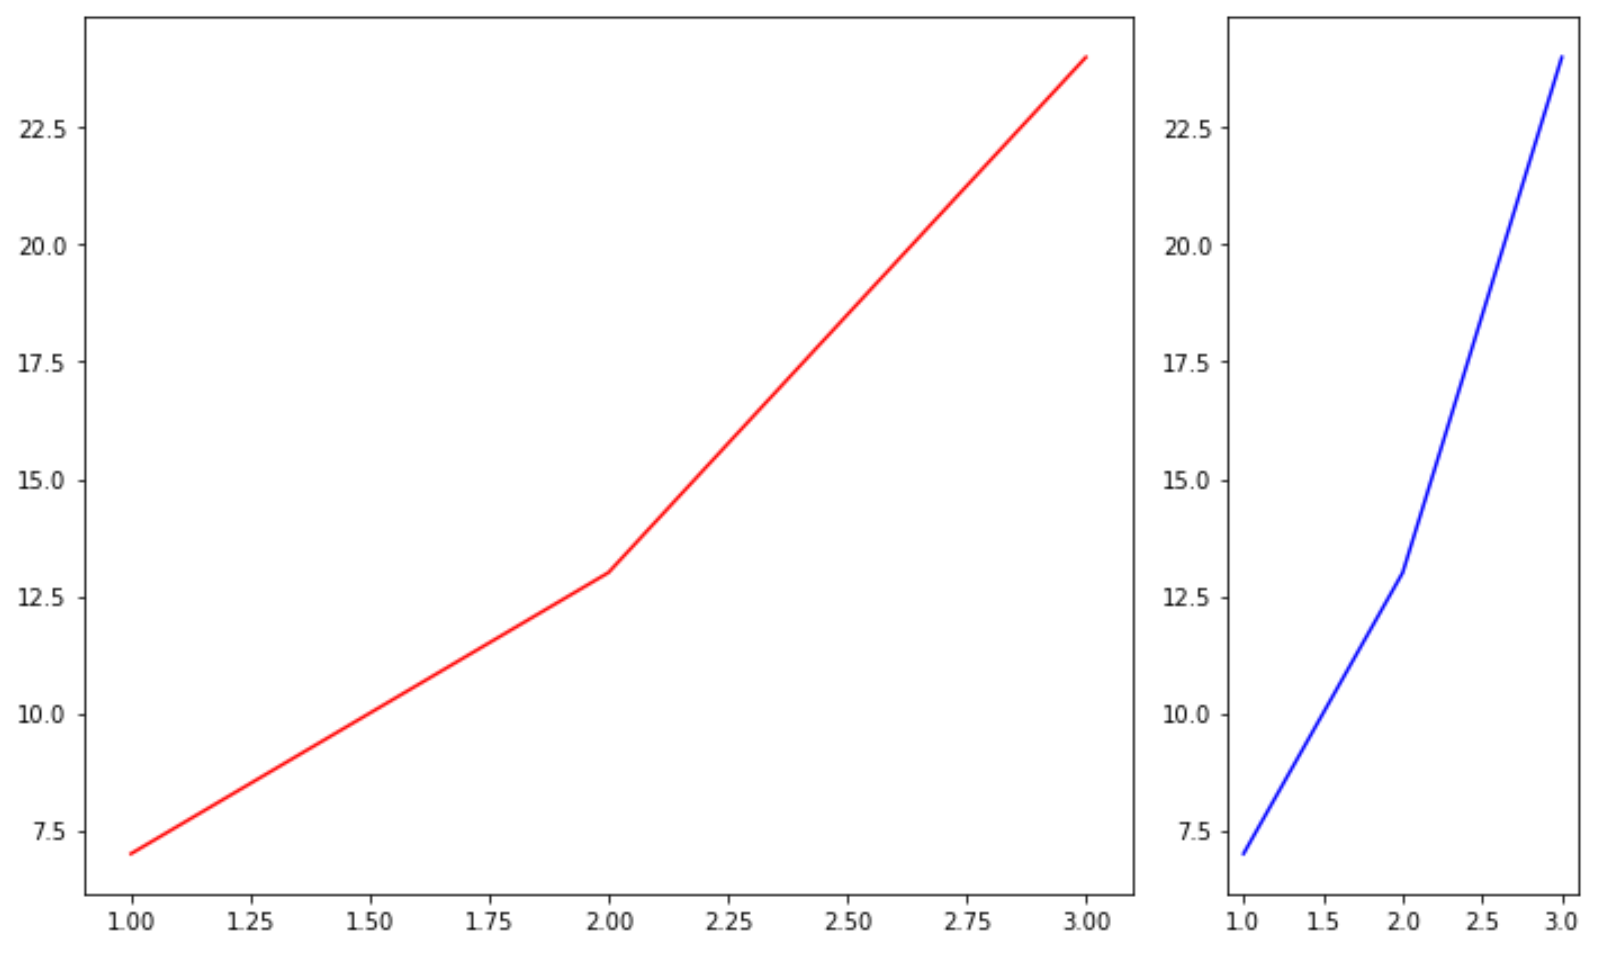
O código a seguir mostra como especificar tamanhos diferentes para subparcelas individuais:
 import matplotlib. pyplot as plt

#define subplots
fig, ax = plt. subplots (1, 2, gridspec_kw={' width_ratios ': [3, 1]})
fig. tight_layout ()

#define data
x = [1, 2, 3]
y = [7, 13, 24]

#create subplots
ax[0]. plot (x,y,color=' red ')
ax[1]. plot (x,y,color=' blue ')

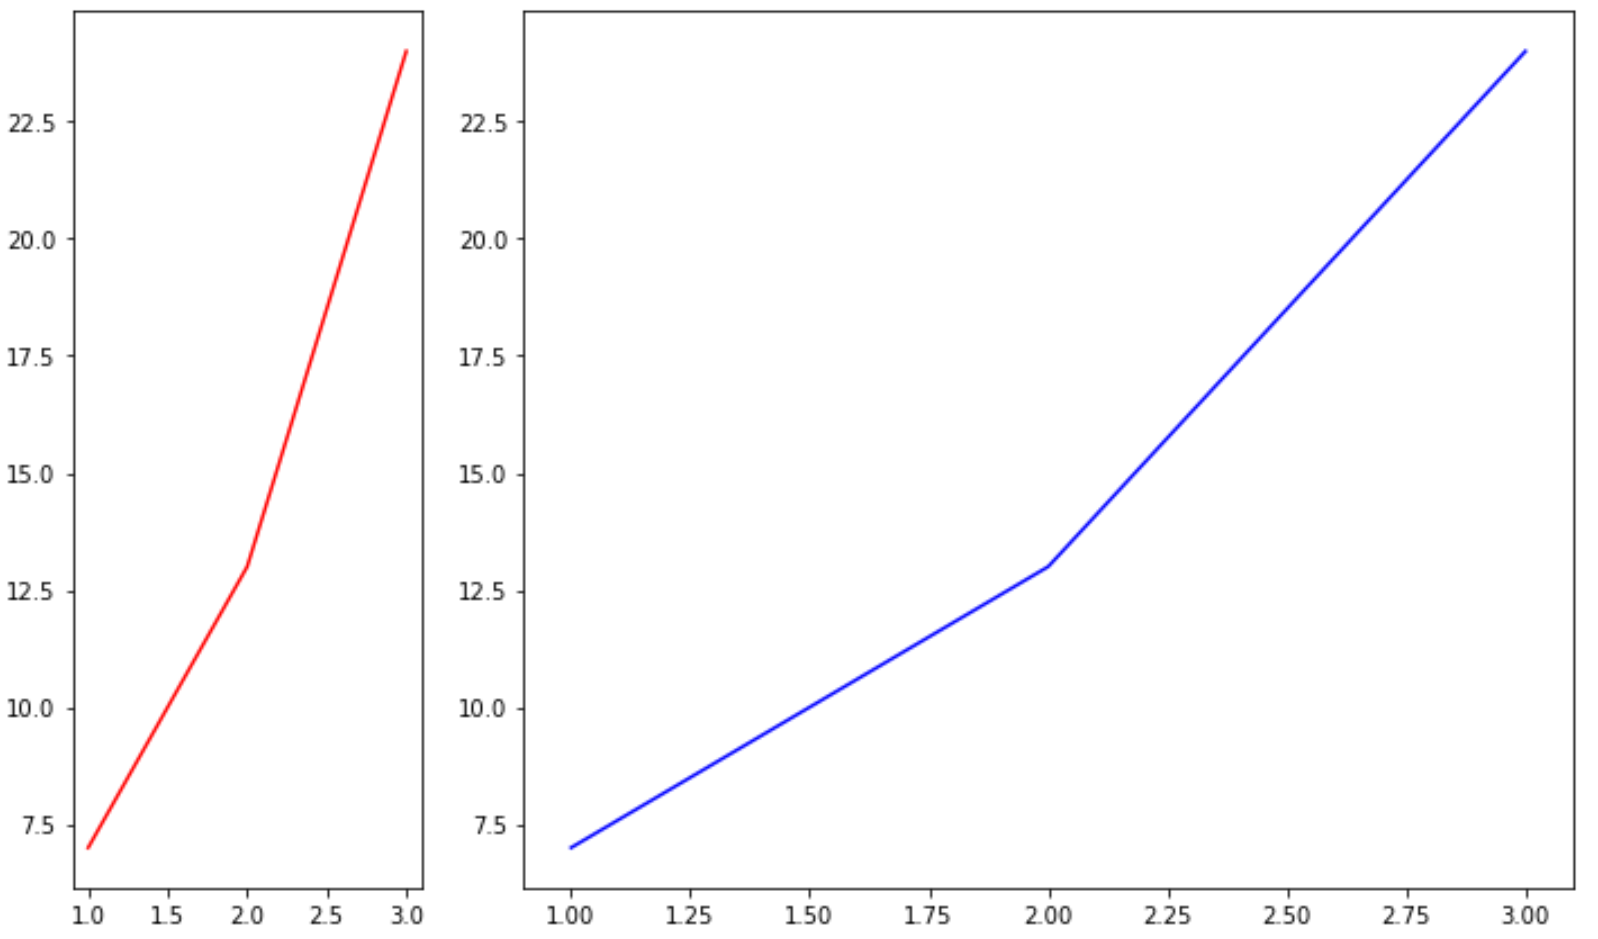
Podemos facilmente alterar o tamanho dos subtraços alterando os valores no argumento width_ratios :
 import matplotlib. pyplot as plt

#define subplots
fig, ax = plt. subplots (1, 2, gridspec_kw={' width_ratios ': [1, 3]})
fig. tight_layout ()

#define data
x = [1, 2, 3]
y = [7, 13, 24]

#create subplots
ax[0]. plot (x,y,color=' red ')
ax[1]. plot (x,y,color=' blue ')

Recursos adicionais
Como adicionar títulos a gráficos no Matplotlib
Como definir intervalos de eixos no Matplotlib
Como definir valores do eixo X no Matplotlib