Como alterar o tamanho da fonte em um gráfico matplotlib
Freqüentemente, você pode querer alterar o tamanho da fonte de vários elementos em um gráfico Matplotlib. Felizmente, isso é fácil de fazer usando o seguinte código:
 import matplotlib.pyplot as plt

plt. rc ('font', size=10) #controls default text size
plt. rc ('axes', titlesize=10) #fontsize of the title
plt. rc ('axes', labelsize=10) #fontsize of the x and y labels
plt. rc ('xtick', labelsize=10) #fontsize of the x tick labels
plt. rc ('ytick', labelsize=10) #fontsize of the y tick labels
plt. rc ('legend', fontsize=10) #fontsize of the legend
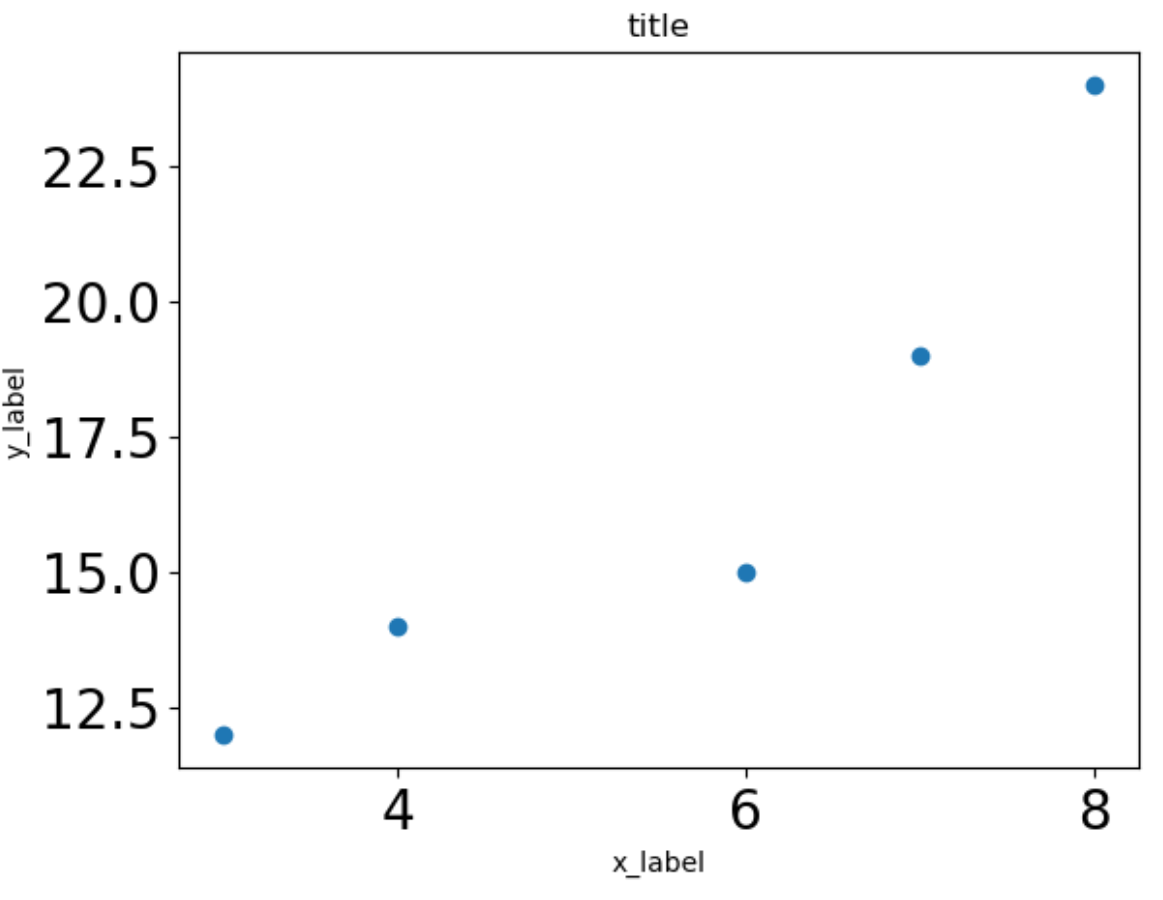
Os exemplos a seguir demonstram como alterar o tamanho da fonte de vários elementos no seguinte gráfico de dispersão matplotlib:
 import matplotlib.pyplot as plt

x = [3, 4, 6, 7, 8]
y = [12, 14, 15, 19, 24]

plt. scatter (x,y)
plt. title ('title')
plt. xlabel ('x_label')
plt. ylabel ('y_label')
plt. show ()
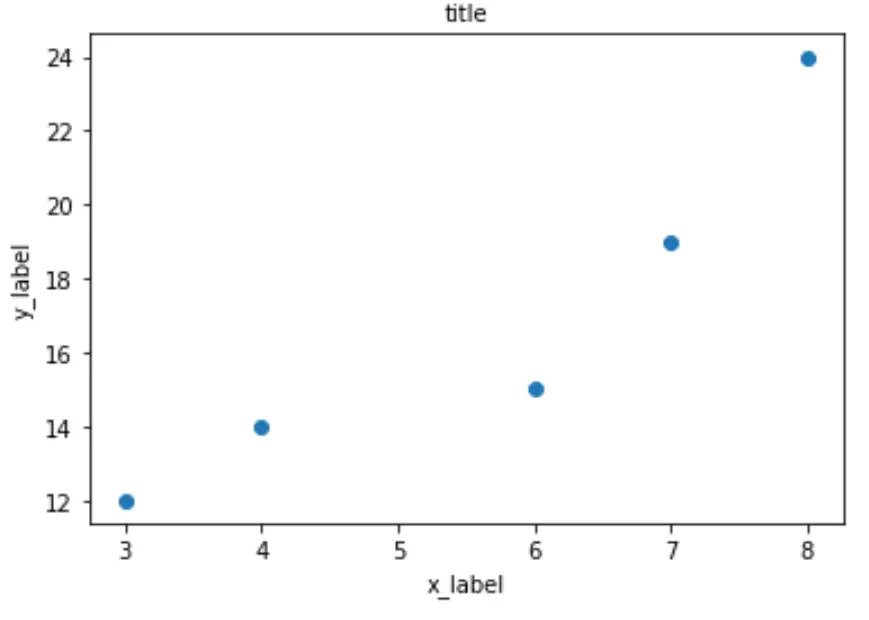
Nota: O tamanho de fonte padrão para todos os elementos é 10 .
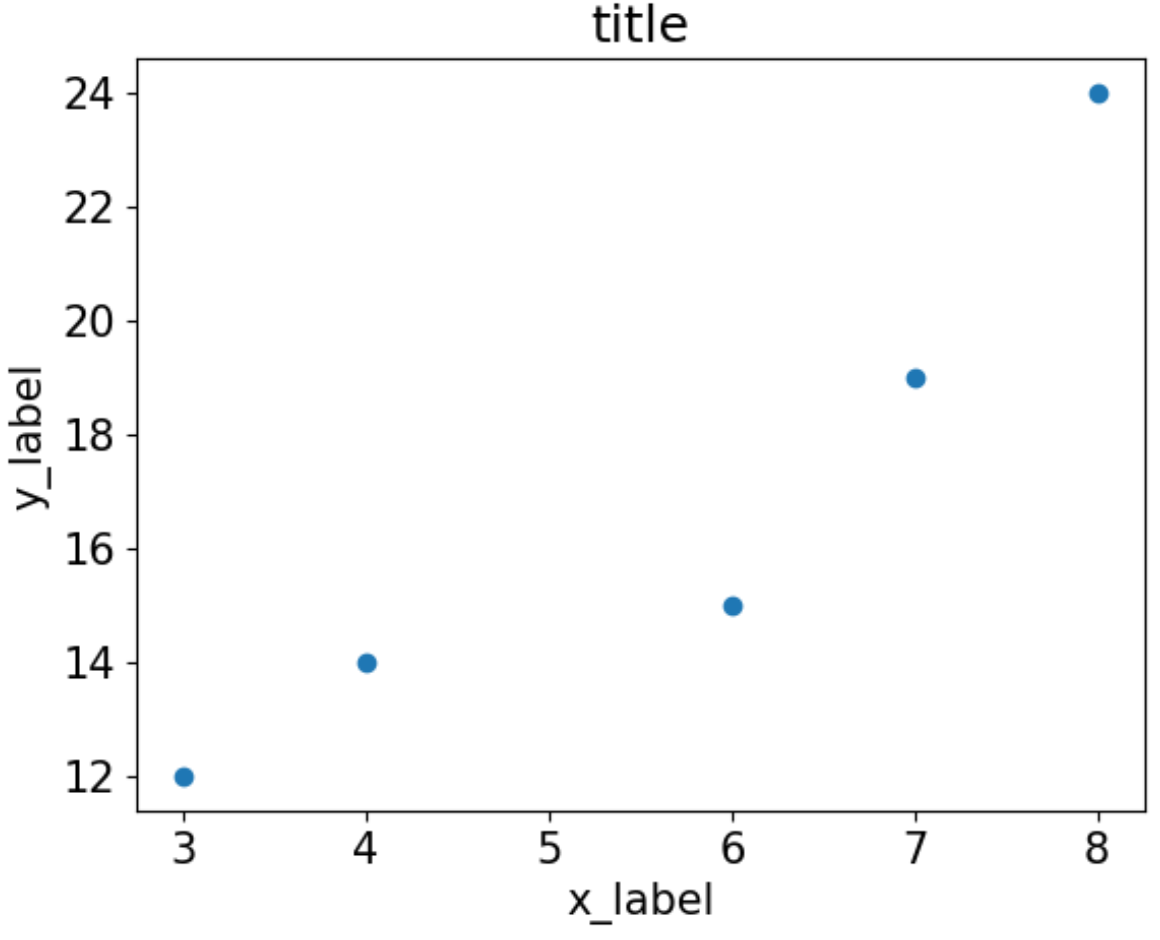
Exemplo 1: Altere o tamanho da fonte de todos os elementos
O código a seguir mostra como alterar o tamanho da fonte de cada elemento do gráfico:
 #set font of all elements to size 15
plt. rc ('font', size= 15 )

#createplot
plt. scatter (x,y)
plt. title ('title')
plt. xlabel ('x_label')
plt. ylabel ('y_label')
plt. show ()
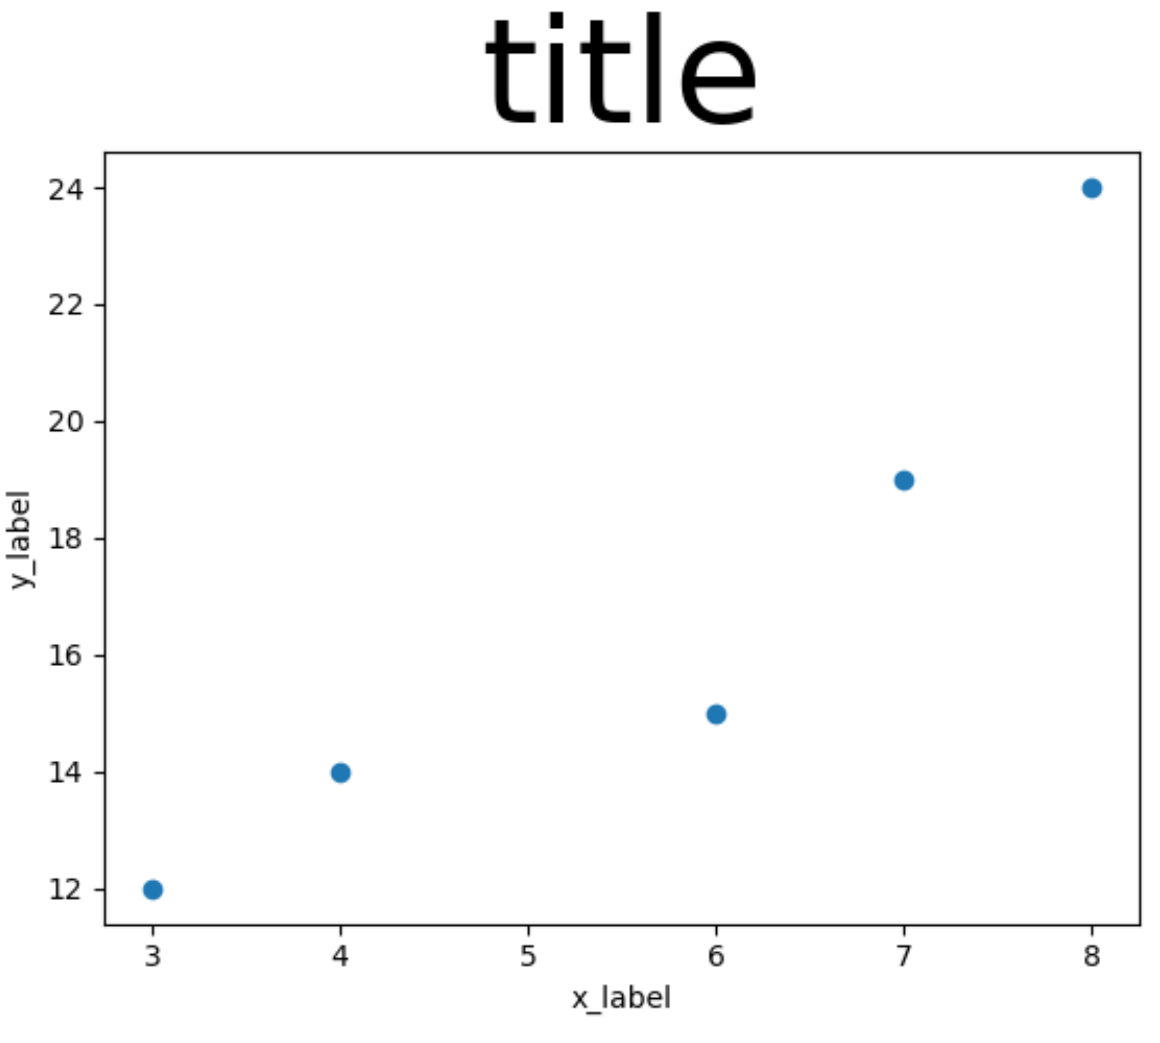
Exemplo 2: Alterar o tamanho da fonte do título
O código a seguir mostra como alterar o tamanho da fonte do título do gráfico:
 #set title font to size 50
plt. rc ('axes', titlesize= 50 )

#createplot
plt. scatter (x,y)
plt. title ('title')
plt. xlabel ('x_label')
plt. ylabel ('y_label')
plt. show ()
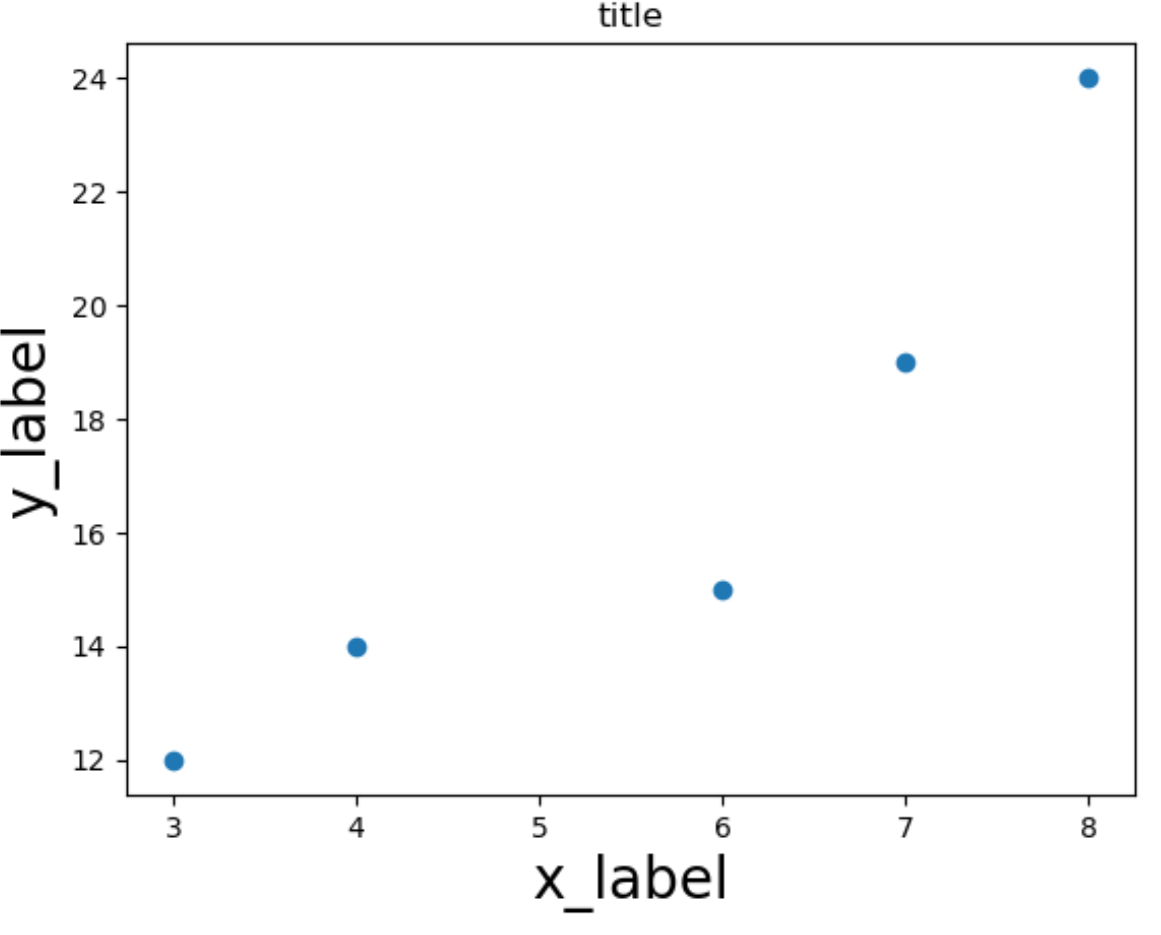
Exemplo 3: Alterar o tamanho da fonte dos rótulos dos eixos
O código a seguir mostra como alterar o tamanho da fonte dos rótulos dos eixos do gráfico:
 #set axes labels font to size 20
plt. rc ('axes', labelsize= 20 )

#createplot
plt. scatter (x,y)
plt. title ('title')
plt. xlabel ('x_label')
plt. ylabel ('y_label')
plt. show ()
Exemplo 4: alterar o tamanho da fonte dos rótulos de marcas de seleção
O código a seguir mostra como alterar o tamanho da fonte dos rótulos de marcação do gráfico:
 #set tick labels font to size 20
plt. rc ('xtick', labelsize= 20 )
plt. rc ('ytick', labelsize= 20 )

#createplot
plt. scatter (x,y)
plt. title ('title')
plt. xlabel ('x_label')
plt. ylabel ('y_label')
plt. show ()
Bônus: restaure os tamanhos de fonte padrão
Você pode usar o código a seguir para restaurar todas as fontes ao tamanho padrão a qualquer momento:
plt.rcParams.update(plt.rcParamsDefault)
Você pode encontrar mais tutoriais do Matplotlib aqui .
About Author
Dr. benjamim anderson
Olá, sou Benjamin, um professor aposentado de estatística que se tornou professor dedicado na Statorials. Com vasta experiência e conhecimento na área de estatística, estou empenhado em compartilhar meu conhecimento para capacitar os alunos por meio de Statorials. Saber mais