Como criar uma curva em forma de sino em python
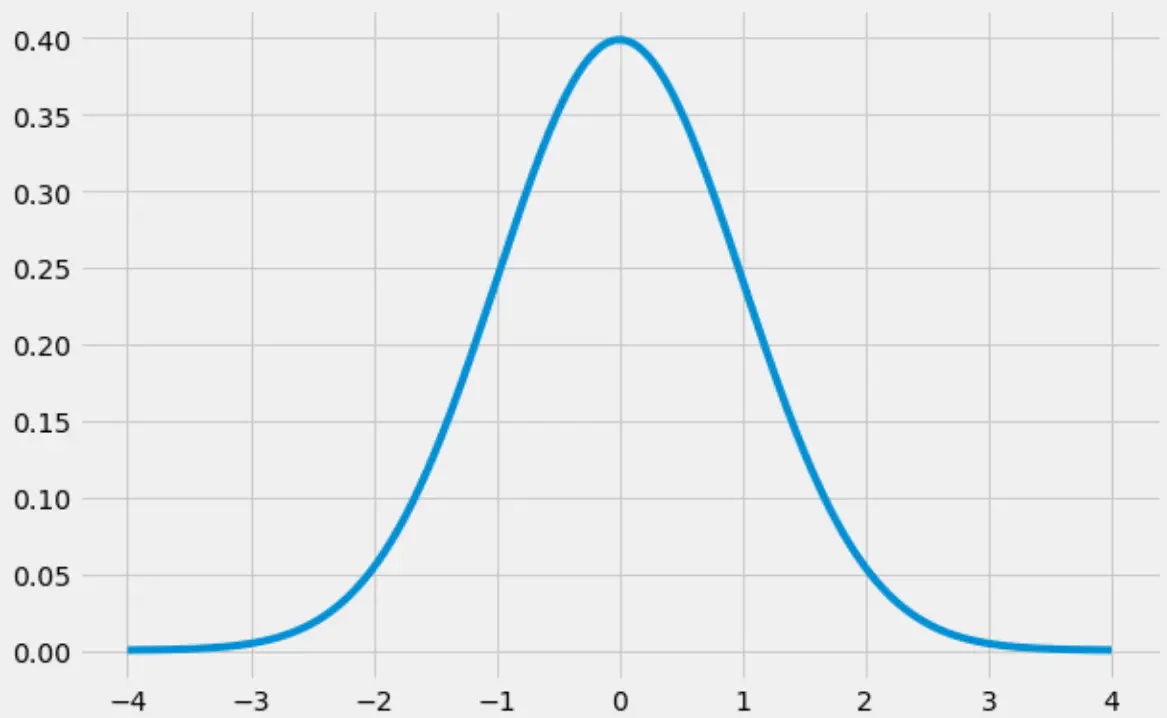
Uma “curva em sino” é o apelido dado ao formato de uma distribuição normal , que possui um formato de “sino” distinto:

Este tutorial explica como criar uma curva em sino em Python.
Como criar uma curva em forma de sino em Python
O código a seguir mostra como criar uma curva em sino usando as bibliotecas numpy , scipy e matplotlib :
 import numpy as np
import matplotlib.pyplot as plt
from scipy.stats import norm

#create range of x-values from -4 to 4 in increments of .001
x = np.arange(-4, 4, 0.001)

#create range of y-values that correspond to normal pdf with mean=0 and sd=1
y = norm.pdf(x,0,1)

#defineplot
fig, ax = plt.subplots(figsize=(9,6))
ax.plot(x,y)

#choose plot style and display the bell curve
plt.style.use('fivethirtyeight')
plt.show()

Como preencher uma curva de sino em Python
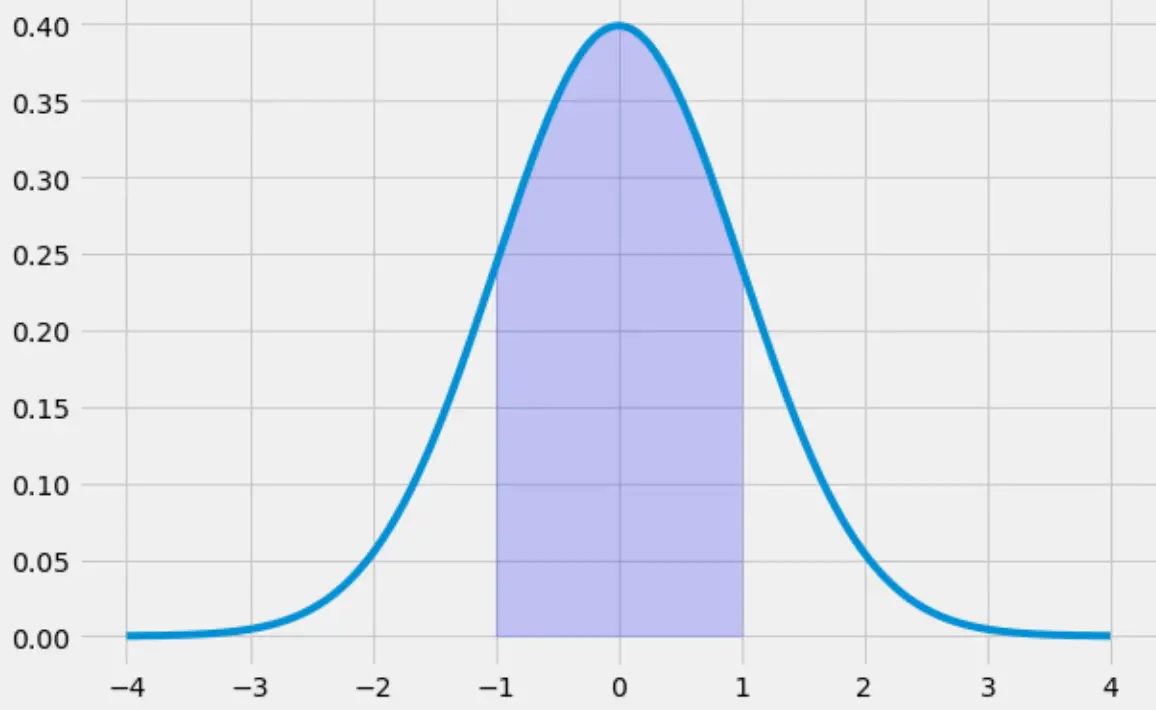
O código a seguir ilustra como preencher a área sob a curva em sino indo de -1 a 1:
 x = np.arange(-4, 4, 0.001)
y = norm.pdf(x,0,1)

fig, ax = plt.subplots(figsize=(9,6))
ax.plot(x,y)

#specify the region of the bell curve to fill in
x_fill = np.arange(-1, 1, 0.001)
y_fill = norm.pdf(x_fill,0,1)
ax.fill_between(x_fill,y_fill,0, alpha=0.2, color='blue')

plt.style.use('fivethirtyeight')
plt.show()

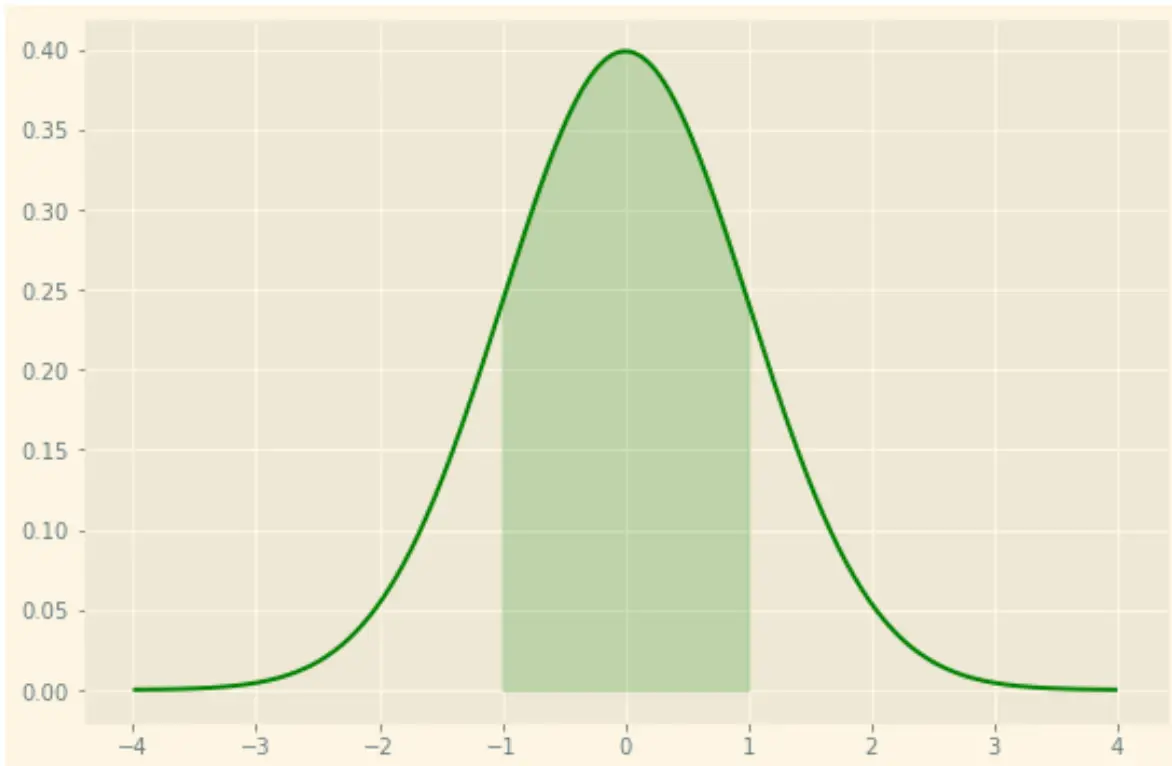
Observe que você também pode estilizar o gráfico da maneira que desejar usando as diversas opções de estilo do matplotlib . Por exemplo, você pode usar um tema “luz solar” com uma linha verde e sombreado verde:
 x = np.arange(-4, 4, 0.001)
y = norm.pdf(x,0,1)

fig, ax = plt.subplots(figsize=(9,6))
ax.plot(x,y, color=' green ')

#specify the region of the bell curve to fill in
x_fill = np.arange(-1, 1, 0.001)
y_fill = norm.pdf(x_fill,0,1)
ax.fill_between(x_fill,y_fill,0, alpha=0.2, color=' green ')

plt.style.use(' Solarize_Light2 ')
plt.show()

Você pode encontrar o guia completo de referência da folha de estilo para matplotlib aqui .