Como criar uma legenda manual em ggplot2 (com exemplos)
Muitas vezes você pode querer adicionar uma legenda manual a um gráfico no ggplot2 com cores, rótulos, título personalizados, etc.
Felizmente, isso é simples de fazer usando a função scale_color_manual() e o exemplo a seguir mostra como fazer isso.
Exemplo: criando uma legenda manual em ggplot2
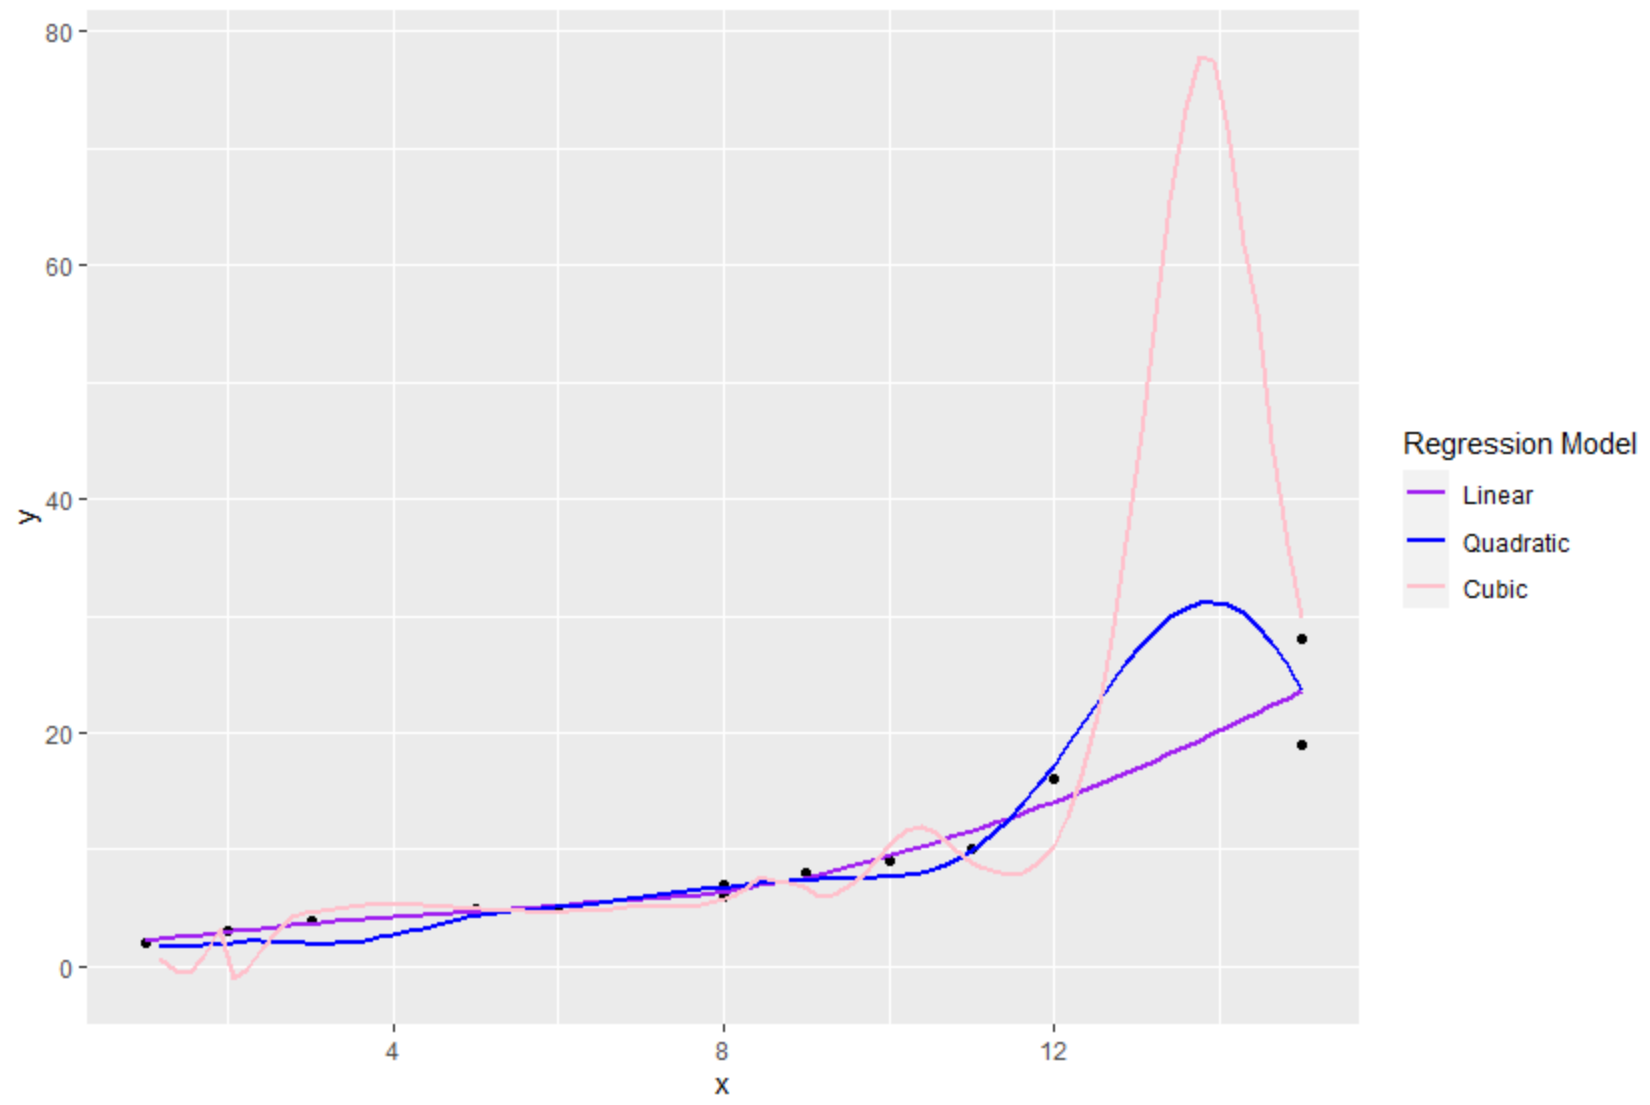
O código a seguir mostra como traçar três linhas de regressão ajustadas em um gráfico em ggplot2 com uma legenda manual personalizada:
 library (ggplot2)

#create data frame
df <- data. frame (x=c(1, 2, 2, 3, 5, 6, 8, 8, 9, 9, 10, 11, 12, 15, 15),
                 y=c(2, 3, 3, 4, 5, 5, 6, 7, 8, 8, 9, 10, 16, 19, 28))

#create plot with three fitted regression models
ggplot(df, aes(x, y)) +
  geom_point() +
  geom_smooth(se= FALSE , aes(color=' Linear ')) +
  geom_smooth(formula=y~poly(x, 2), se= FALSE , aes(color=' Quadratic ')) +
  geom_smooth(formula=y~poly(x, 3), se= FALSE , aes(color=' Cubic ')) +
  scale_color_manual(name=' Regression Model ',
                     breaks=c(' Linear ', ' Quadratic ', ' Cubic '),
                     values=c(' Cubic '=' pink ', ' Quadratic '=' blue ', ' Linear '=' purple '))

Usando a função scale_color_manual() , pudemos especificar os seguintes aspectos da legenda:
- nome : O título da legenda
- breaks : rótulos na legenda
- valores : as cores na legenda
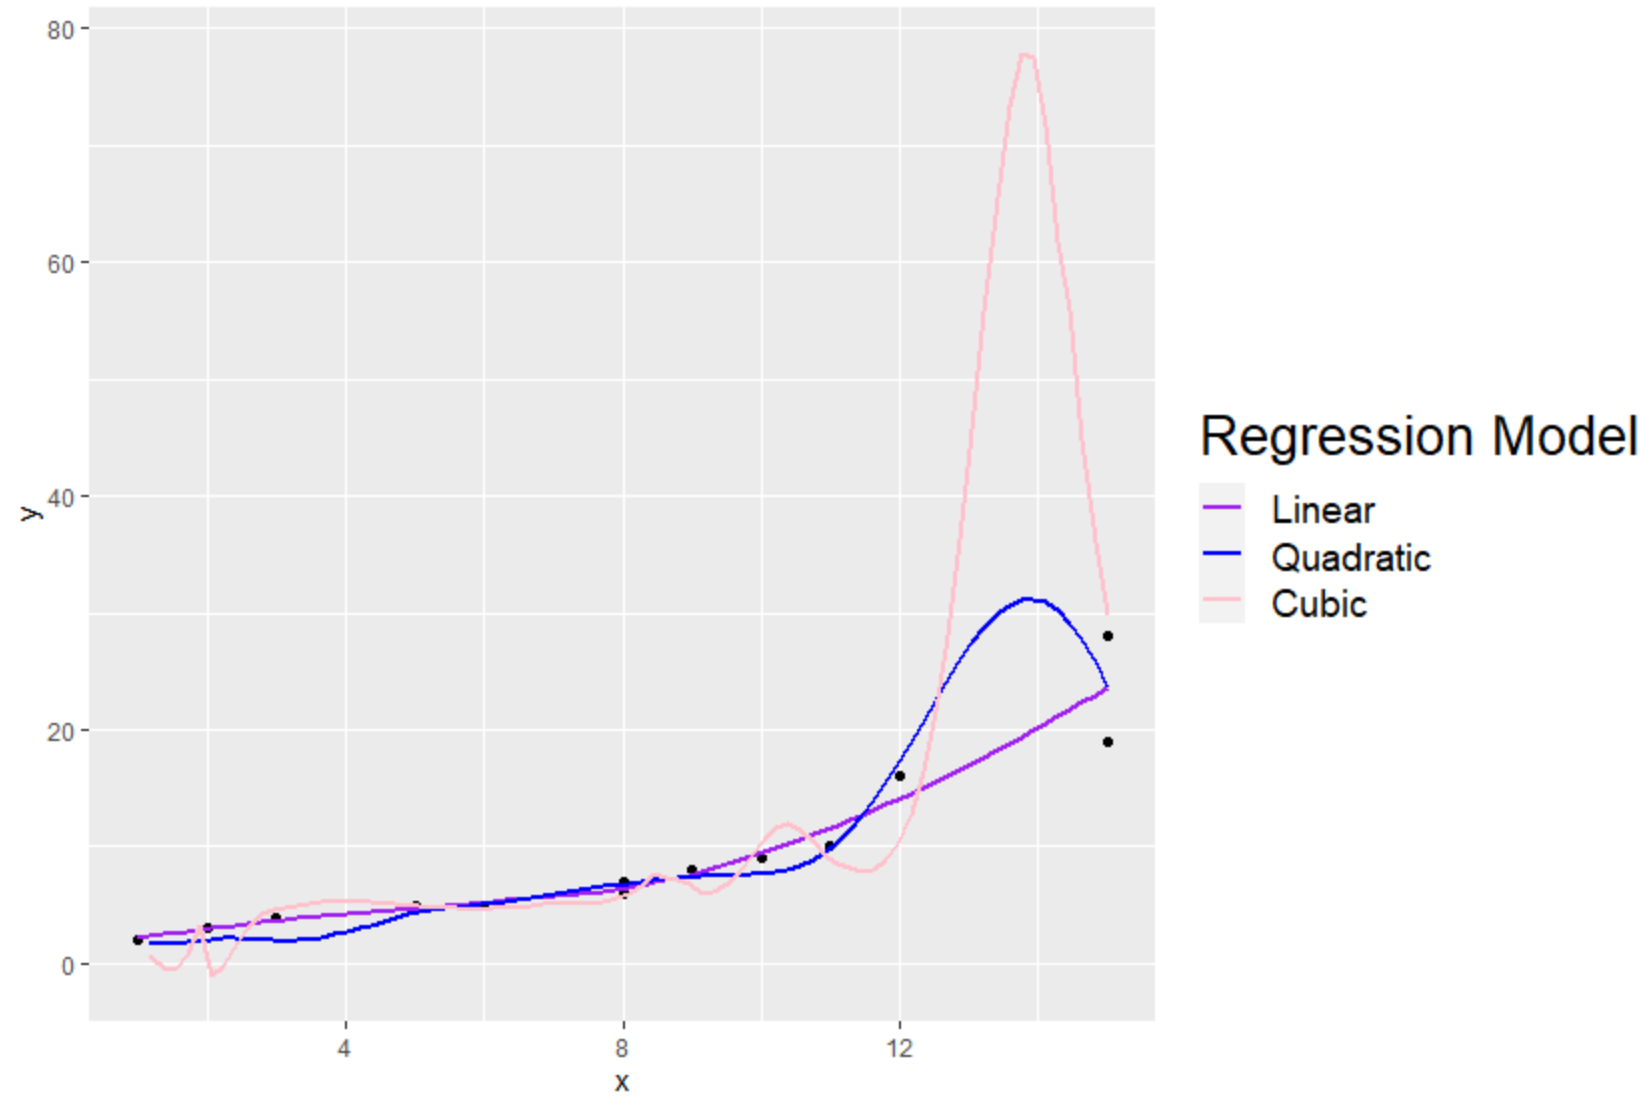
Observe que também podemos usar a função theme() para alterar o tamanho da fonte dos elementos da legenda:
 library (ggplot2)

#create data frame
df <- data. frame (x=c(1, 2, 2, 3, 5, 6, 8, 8, 9, 9, 10, 11, 12, 15, 15),
                 y=c(2, 3, 3, 4, 5, 5, 6, 7, 8, 8, 9, 10, 16, 19, 28))

#create plot with three fitted regression models
ggplot(df, aes(x, y)) +
  geom_point() +
  geom_smooth(se= FALSE , aes(color=' Linear ')) +
  geom_smooth(formula=y~poly(x, 2), se= FALSE , aes(color=' Quadratic ')) +
  geom_smooth(formula=y~poly(x, 3), se= FALSE , aes(color=' Cubic ')) +
  scale_color_manual(name=' Regression Model ',
                     breaks=c(' Linear ', ' Quadratic ', ' Cubic '),
                     values=c(' Cubic '=' pink ', ' Quadratic '=' blue ', ' Linear '=' purple '))+
 theme(legend. title =element_text(size= 20 ),
       legend. text =element_text(size= 14 ))

Observe que o tamanho da fonte dos rótulos de título e legenda foi aumentado.
Recursos adicionais
Os tutoriais a seguir explicam como realizar outras operações comuns no ggplot2:
Como alterar a posição da legenda no ggplot2
Como alterar o tamanho da legenda no ggplot2
Como alterar o título da legenda no ggplot2
Como alterar os rótulos das legendas no ggplot2