Como desenhar uma linha horizontal no matplotlib (com exemplos)
Você pode usar a seguinte sintaxe para traçar uma linha horizontal no Matplotlib:
 import matplotlib. pyplot as plt

#draw vertical line at y=10
plt. axhlin (y=10)
Os exemplos a seguir mostram como usar essa sintaxe na prática com o seguinte DataFrame do pandas:
 import pandas as pd

#createDataFrame
df = pd. DataFrame ({' x ': [1, 2, 3, 4, 5, 6, 7, 8],
                   ' y ': [5, 7, 8, 15, 26, 39, 45, 40]})

#view DataFrame
df

	x y
0 1 5
1 2 7
2 3 8
3 4 15
4 5 26
5 6 39
6 7 45
7 8 40
Exemplo 1: desenhar uma linha horizontal
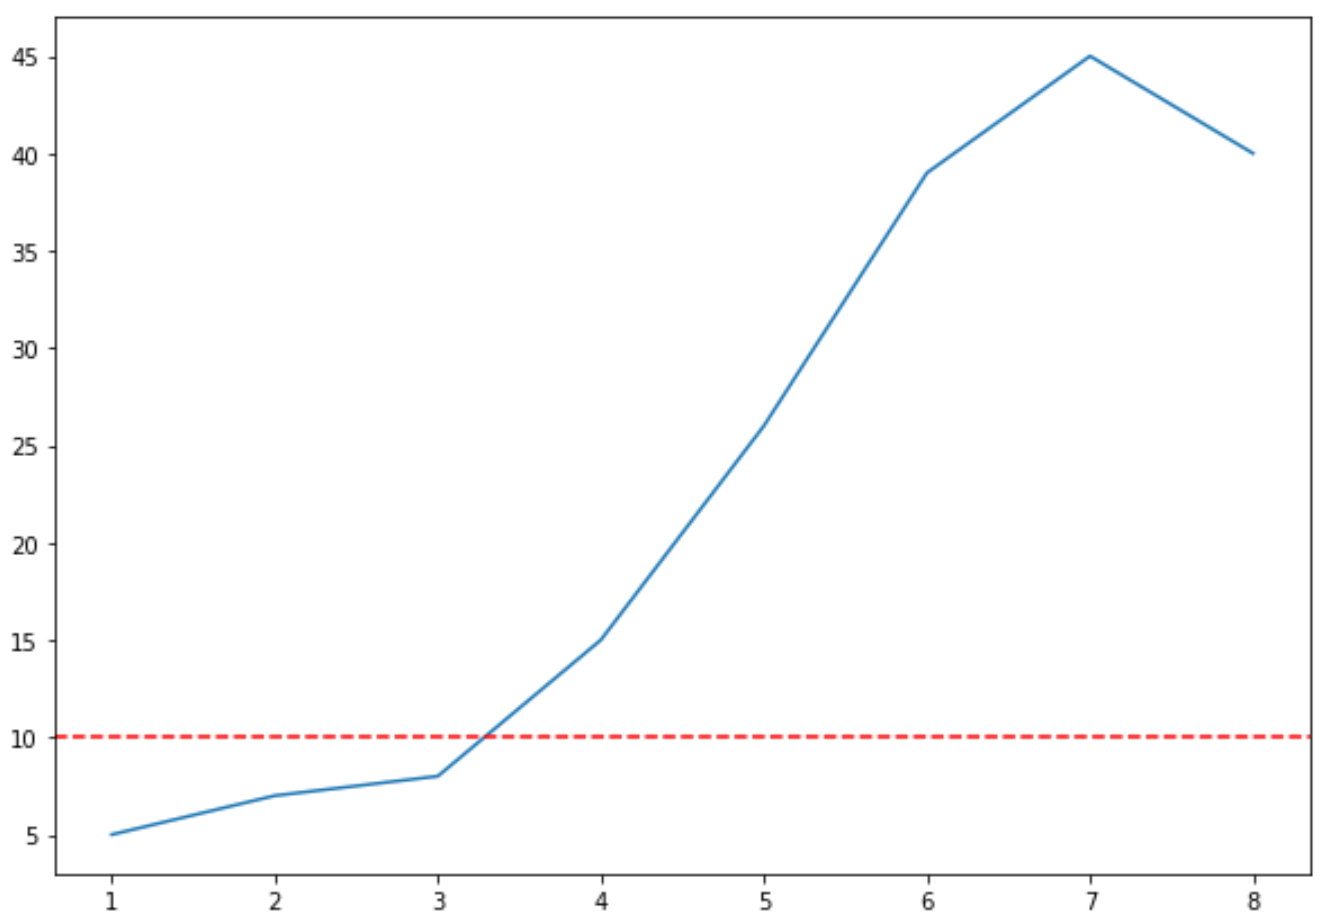
O código a seguir mostra como desenhar uma linha horizontal em um gráfico Matplotlib:
 import matplotlib. pyplot as plt

#create line plot
plt. plot (df. x , df. y )

#add horizontal line at y=10
plt. axhline (y=10, color=' red ', linestyle=' -- ')

Exemplo 2: desenhar várias linhas horizontais
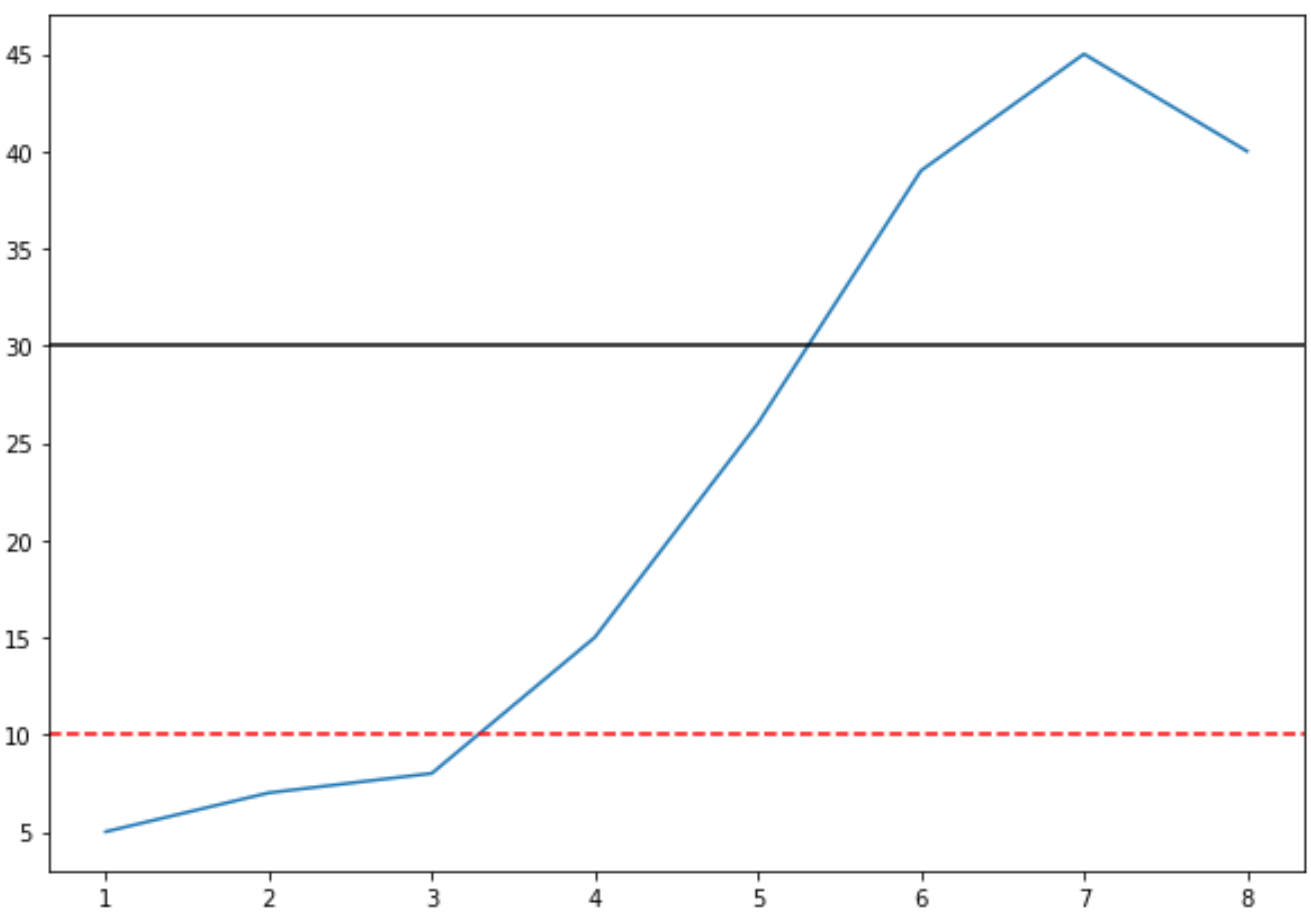
O código a seguir mostra como desenhar várias linhas horizontais em um gráfico Matplotlib:
 import matplotlib. pyplot as plt

#create line plot
plt. plot (df. x , df. y )

#add horizontal line at y=10
plt. axhline (y=10, color=' red ', linestyle=' -- ')

#add horizontal line at y=30
plt. axhline (y=30, color=' black ', linestyle=' - ')

Exemplo 3: desenhe múltiplas linhas horizontais com uma legenda
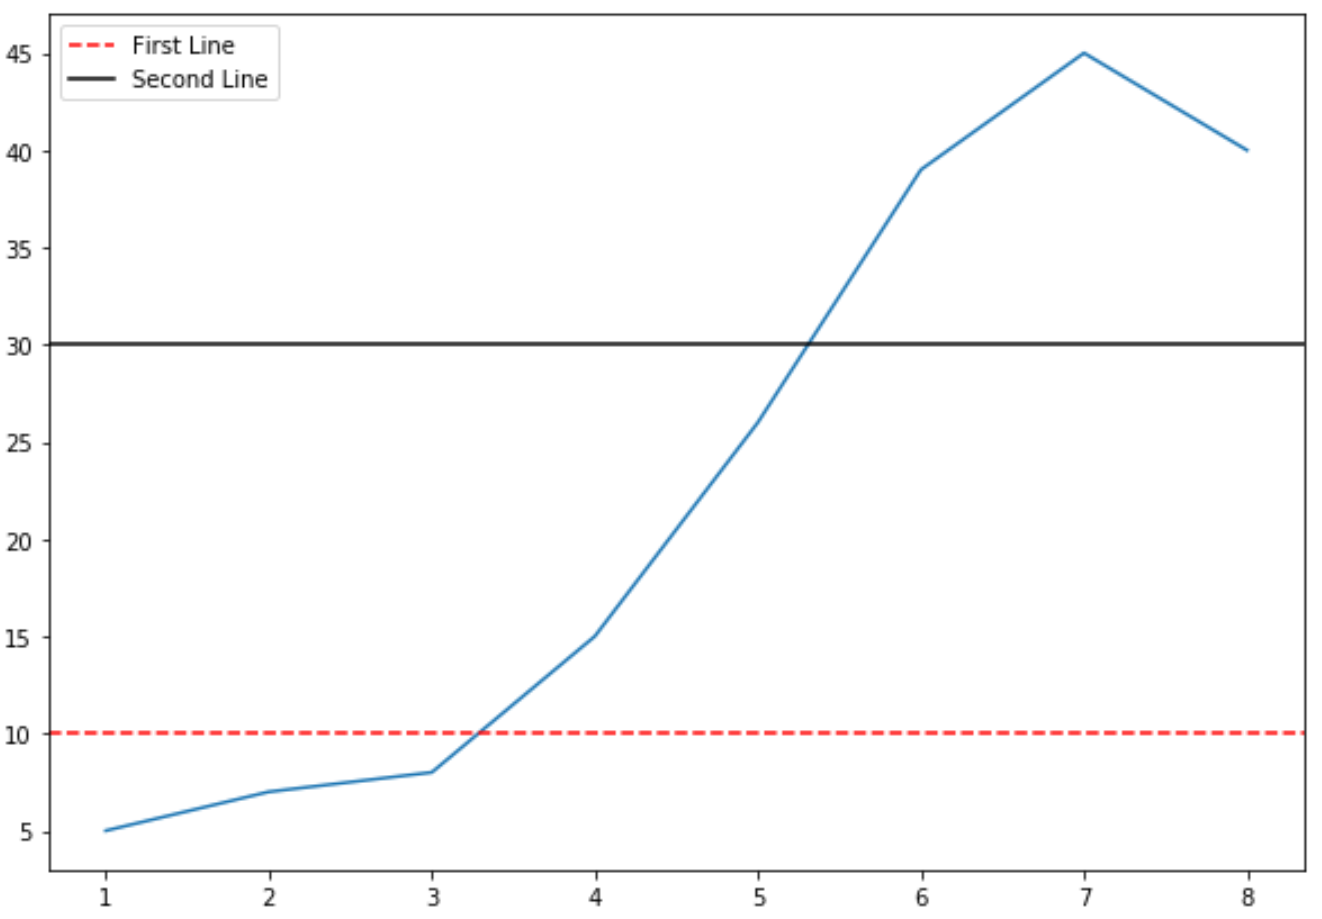
O código a seguir mostra como desenhar várias linhas horizontais em um gráfico Matplotlib e adicionar uma legenda para facilitar a interpretação das linhas:
 import matplotlib. pyplot as plt

#create line plot
plt. plot (df. x , df. y )

#add horizontal line at y=10
plt. axhline (y=10, color=' red ', linestyle=' -- ', label=' First Line ')

#add horizontal line at y=30
plt. axhline (y=30, color=' black ', linestyle=' - ', label=' Second Line ')

#add legend
plt. legend ()

Nota: Consulte a documentação do Matplotlib para obter uma lista completa de cores e estilos de linha que você pode aplicar às linhas horizontais.
Recursos adicionais
Como desenhar uma linha vertical no Matplotlib
Como plotar múltiplas linhas no Matplotlib
Como traçar uma série temporal no Matplotlib
Como desenhar retângulos no Matplotlib
Como desenhar setas no Matplotlib