Como usar tight_layout() no matplotlib
Você pode usar a função Tight_layout() no Matplotlib para ajustar automaticamente o preenchimento entre e ao redor das subparcelas.
O exemplo a seguir mostra como usar esta função na prática.
Exemplo: como usar Tight_layout() no Matplotlib
Suponha que usemos Matplotilb para criar quatro subparcelas em uma grade 2×2:
 import matplotlib. pyplot as plt

#define data
x = [1, 2, 3]
y = [7, 13, 24]

#define layout for subplots
fig, ax = plt. subplots (2, 2)

#define subplot titles
ax[0, 0]. plot (x,y,color=' red ')
ax[0, 1]. plot (x,y,color=' blue ')
ax[1, 0]. plot (x,y,color=' green ')
ax[1, 1]. plot (x,y,color=' purple ')

#add title to each subplot
ax[0, 0]. set_title (' First Subplot ')
ax[0, 1]. set_title (' Second Subplot ')
ax[1, 0]. set_title (' Third Subplot ')
ax[1, 1]. set_title (' Fourth Subplot ')

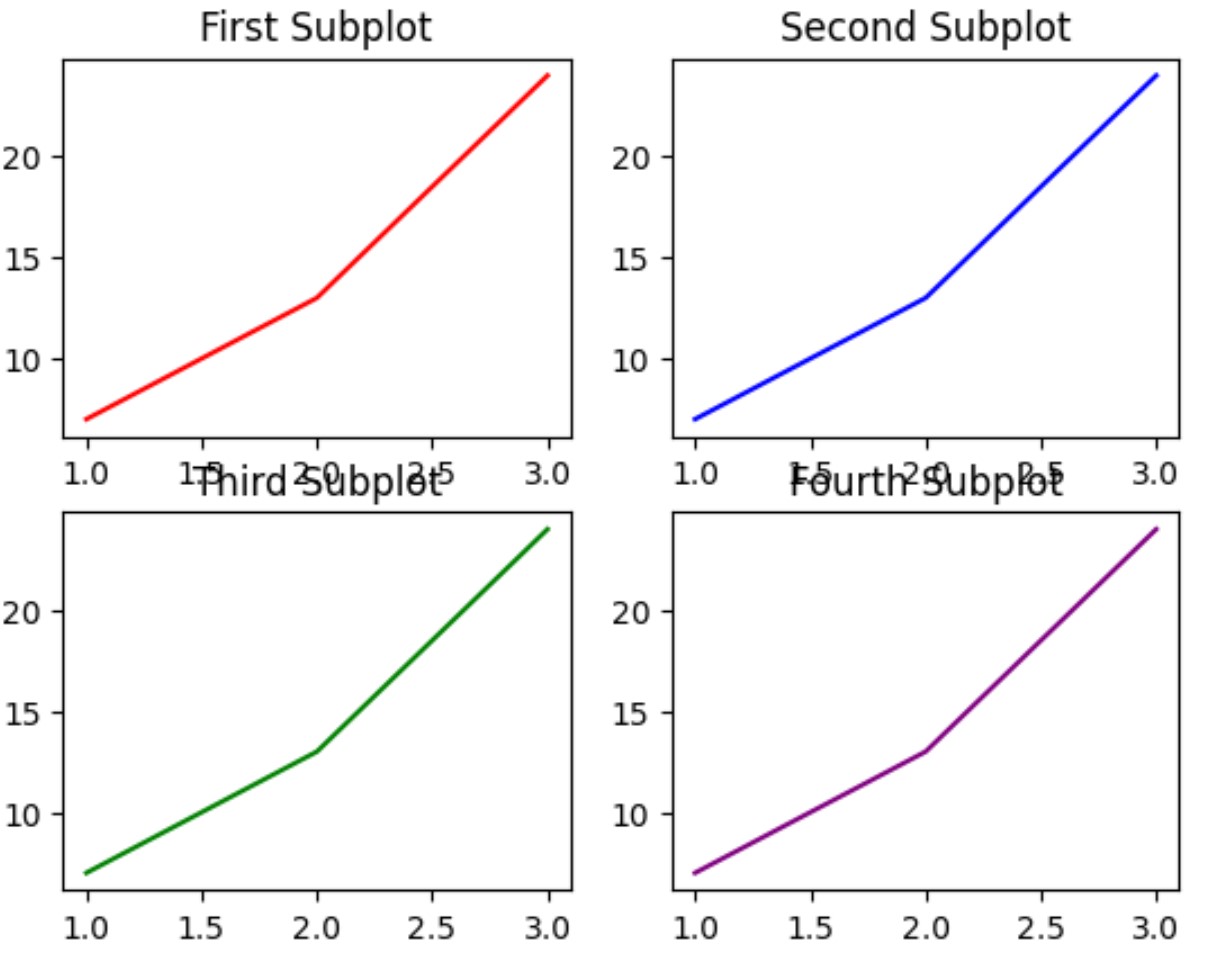
Observe que há um preenchimento mínimo entre as subparcelas, resultando na sobreposição de títulos em alguns lugares.
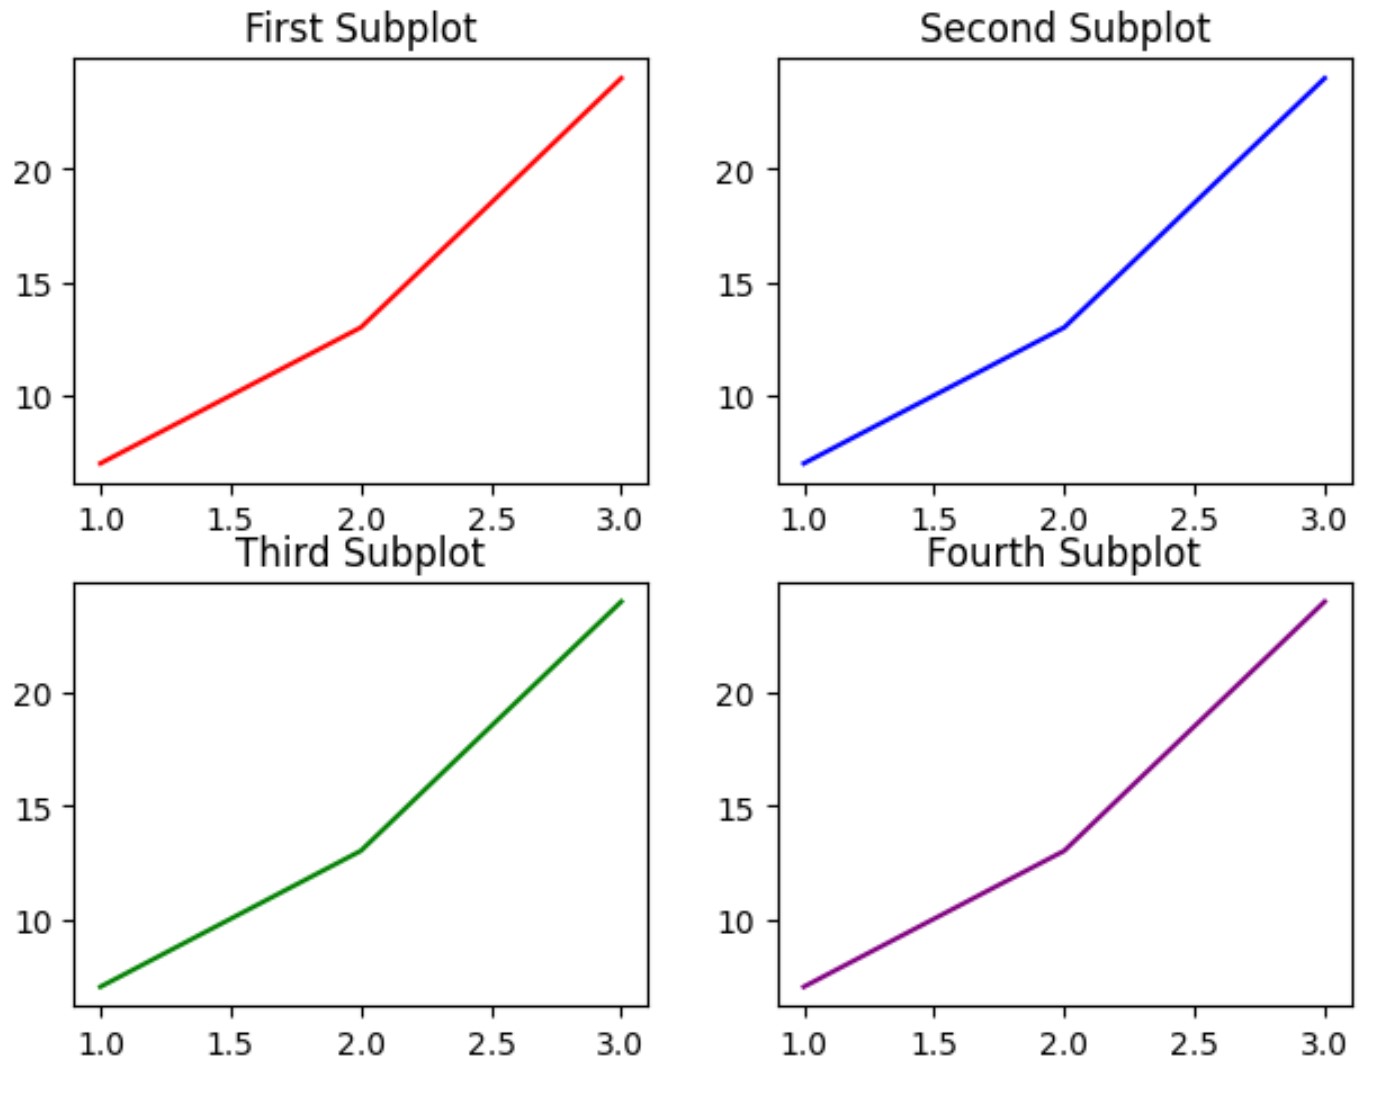
Ao especificar fig.tight_layout() podemos ajustar automaticamente o preenchimento entre e ao redor das subparcelas:
 import matplotlib. pyplot as plt

#define data
x = [1, 2, 3]
y = [7, 13, 24]

#define layout for subplots
fig, ax = plt. subplots (2, 2)

#specify a tight layout
fig. tight_layout ()

#define subplot titles
ax[0, 0]. plot (x,y,color=' red ')
ax[0, 1]. plot (x,y,color=' blue ')
ax[1, 0]. plot (x,y,color=' green ')
ax[1, 1]. plot (x,y,color=' purple ')

#add title to each subplot
ax[0, 0]. set_title (' First Subplot ')
ax[0, 1]. set_title (' Second Subplot ')
ax[1, 0]. set_title (' Third Subplot ')
ax[1, 1]. set_title (' Fourth Subplot ')

Observe que o preenchimento entre e ao redor das subparcelas foi ajustado para que as parcelas não se sobreponham mais em nenhuma área.
Observe que a função Tight_layout() usa um argumento pad para especificar o preenchimento entre a borda da figura e as bordas do subcaminho, como uma fração do tamanho da fonte.
O valor padrão do bloco é 1,08 . No entanto, podemos aumentar este valor para aumentar o preenchimento em torno dos caminhos:
 import matplotlib. pyplot as plt

#define data
x = [1, 2, 3]
y = [7, 13, 24]

#define layout for subplots
fig, ax = plt. subplots (2, 2)

#specify a tight layout with increased padding
fig. tight_layout (pad=5)

#define subplot titles
ax[0, 0]. plot (x,y,color=' red ')
ax[0, 1]. plot (x,y,color=' blue ')
ax[1, 0]. plot (x,y,color=' green ')
ax[1, 1]. plot (x,y,color=' purple ')

#add title to each subplot
ax[0, 0]. set_title (' First Subplot ')
ax[0, 1]. set_title (' Second Subplot ')
ax[1, 0]. set_title (' Third Subplot ')
ax[1, 1]. set_title (' Fourth Subplot ')

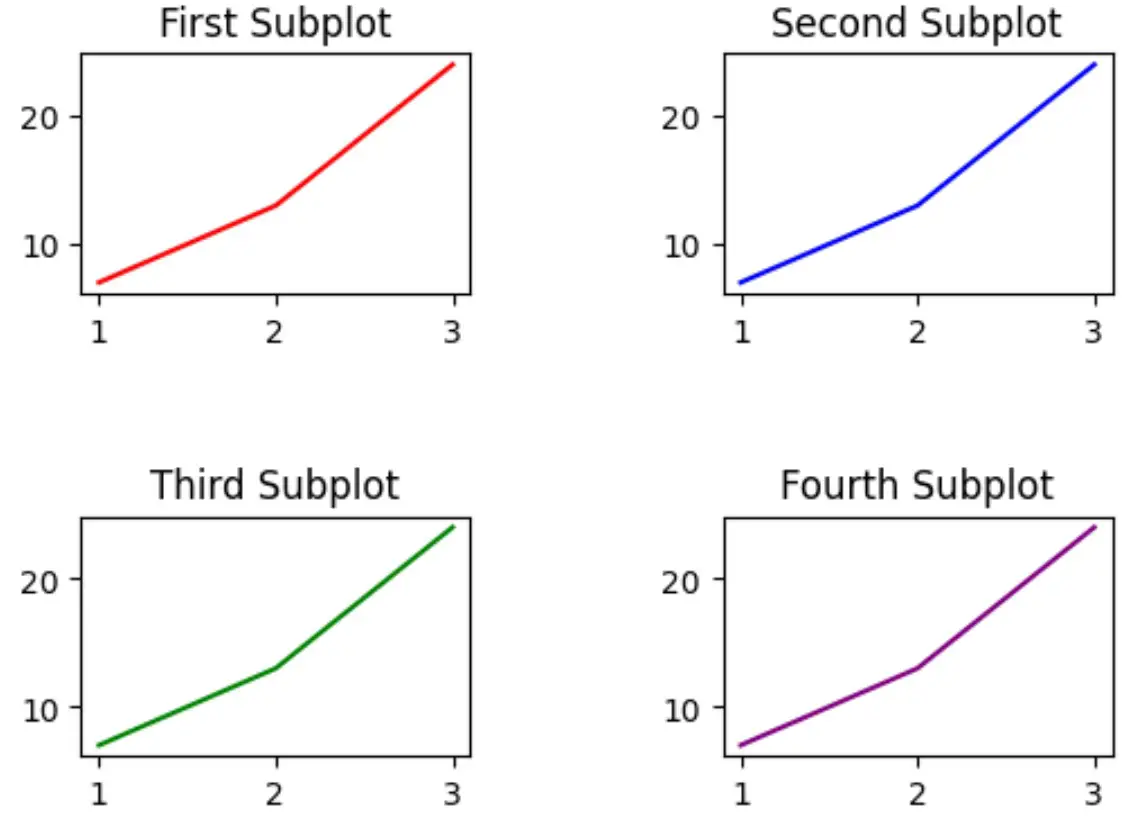
Observe que o preenchimento ao redor das parcelas aumentou visivelmente.
Sinta-se à vontade para ajustar o valor do argumento pad para aumentar o preenchimento ao redor dos caminhos tanto quanto desejar.
Recursos adicionais
Os tutoriais a seguir explicam como realizar outras tarefas comuns no Matplotlib:
Como adicionar um título às subparcelas no Matplotlib
Como ajustar o tamanho da subparcela no Matplotlib
Como ajustar o espaçamento entre subtramas do Matplotlib