Como desenhar retângulos no matplotlib (com exemplos)
Para desenhar um retângulo no Matplotlib, você pode usar a função matplotlib.patches.Rectangle , que usa a seguinte sintaxe:
matplotlib.patches.Rectangle(xy, largura, altura, ângulo=0,0)
Ouro:
- xy: as coordenadas (x, y) do ponto de ancoragem do retângulo
- largura: largura do retângulo
- altura: altura do retângulo
- ângulo: Rotação em graus no sentido anti-horário em torno de xy (o padrão é 0)
Este tutorial fornece vários exemplos de uso prático desta função.
Exemplo 1: desenhe um retângulo em um caminho
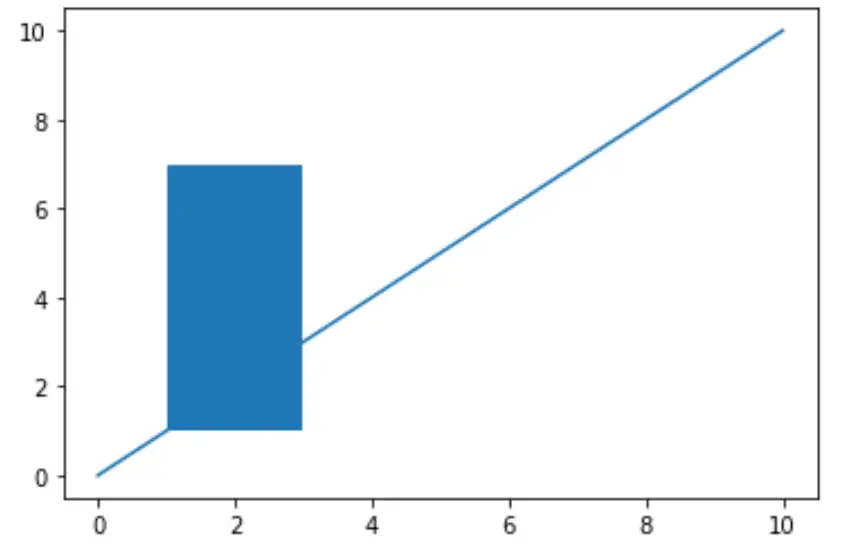
O código a seguir mostra como desenhar um retângulo em um gráfico Matplotlib com largura 2 e altura 6:
 import matplotlib. pyplot as plt
from matplotlib. patches import Rectangle

#define Matplotlib figure and axis
fig, ax = plt. subplots ()

#create simple line plot
ax. plot ([0, 10],[0, 10])

#add rectangle to plot
ax. add_patch (Rectangle((1, 1), 2, 6))

#displayplot
plt. show ()

Exemplo 2: estilizar um retângulo
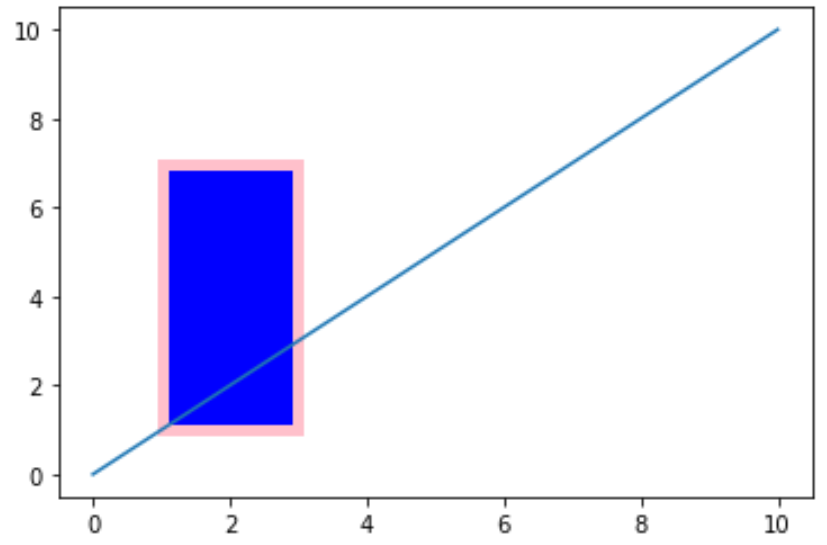
O código a seguir mostra como estilizar o retângulo:
 import matplotlib. pyplot as plt
from matplotlib. patches import Rectangle

#define Matplotlib figure and axis
fig, ax = plt. subplots ()

#create simple line plot
ax. plot ([0, 10],[0, 10])

#add rectangle to plot
ax. add_patch (Rectangle((1, 1), 2, 6,
             edgecolor = ' pink ',
             facecolor = ' blue ',
             fill= True ,
             lw= 5 ))

#displayplot
plt. show ()

Você pode encontrar uma lista completa de propriedades de estilo que podem ser aplicadas a um retângulo aqui .
Exemplo 3: desenhe um retângulo em uma imagem
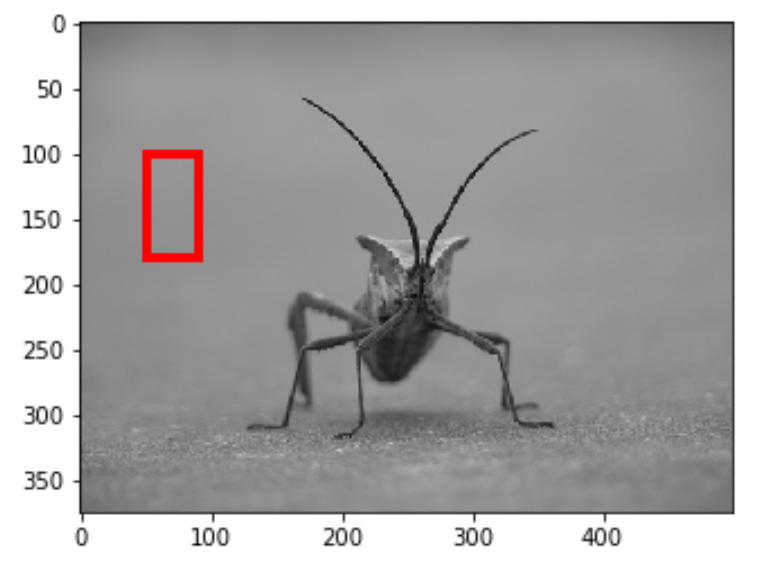
O código a seguir mostra como desenhar um retângulo em uma imagem no Matplotilb. Observe que a imagem usada neste exemplo vem deste tutorial do Matplotlib .
Para reproduzir este exemplo, basta baixar a foto da tachinha deste tutorial e salvá-la em seu próprio computador.
 import matplotlib. pyplot as plt
from matplotlib. patches import Rectangle
from PIL import Image

#display the image
plt. imshow ( Image.open (' stinkbug.png '))

#add rectangle
plt. gca (). add_patch (Rectangle((50,100),40,80,
                    edgecolor=' red ',
                    facecolor=' none ',
                    lw= 4 ))

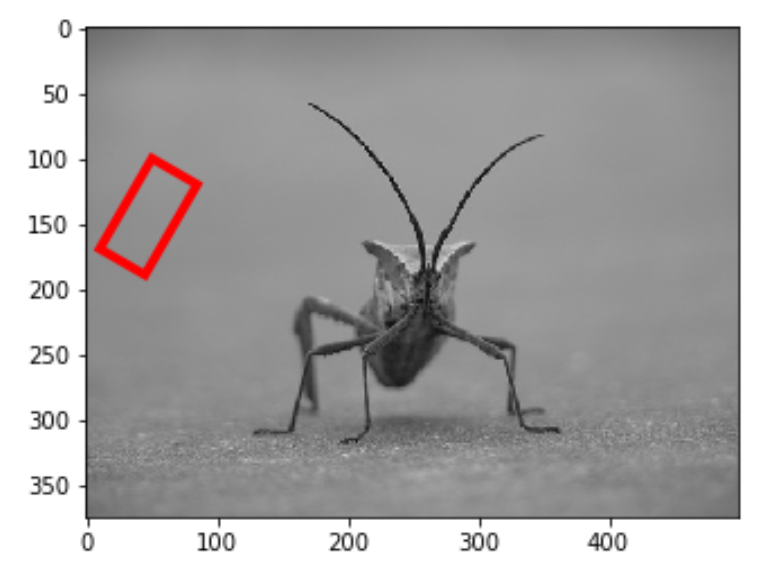
Observe que podemos usar o argumento ângulo para girar o retângulo um certo número de graus no sentido anti-horário:
 import matplotlib. pyplot as plt
from matplotlib. patches import Rectangle
from PIL import Image

#display the image
plt. imshow ( Image.open (' stinkbug.png '))

#add rectangle
plt. gca (). add_patch (Rectangle((50,100),40,80,
                    angle= 30 ,
                    edgecolor=' red ',
                    facecolor=' none ',
                    lw= 4 ))

Relacionado: Como traçar círculos no Matplotlib (com exemplos)